Spotify Results Presentation Deck
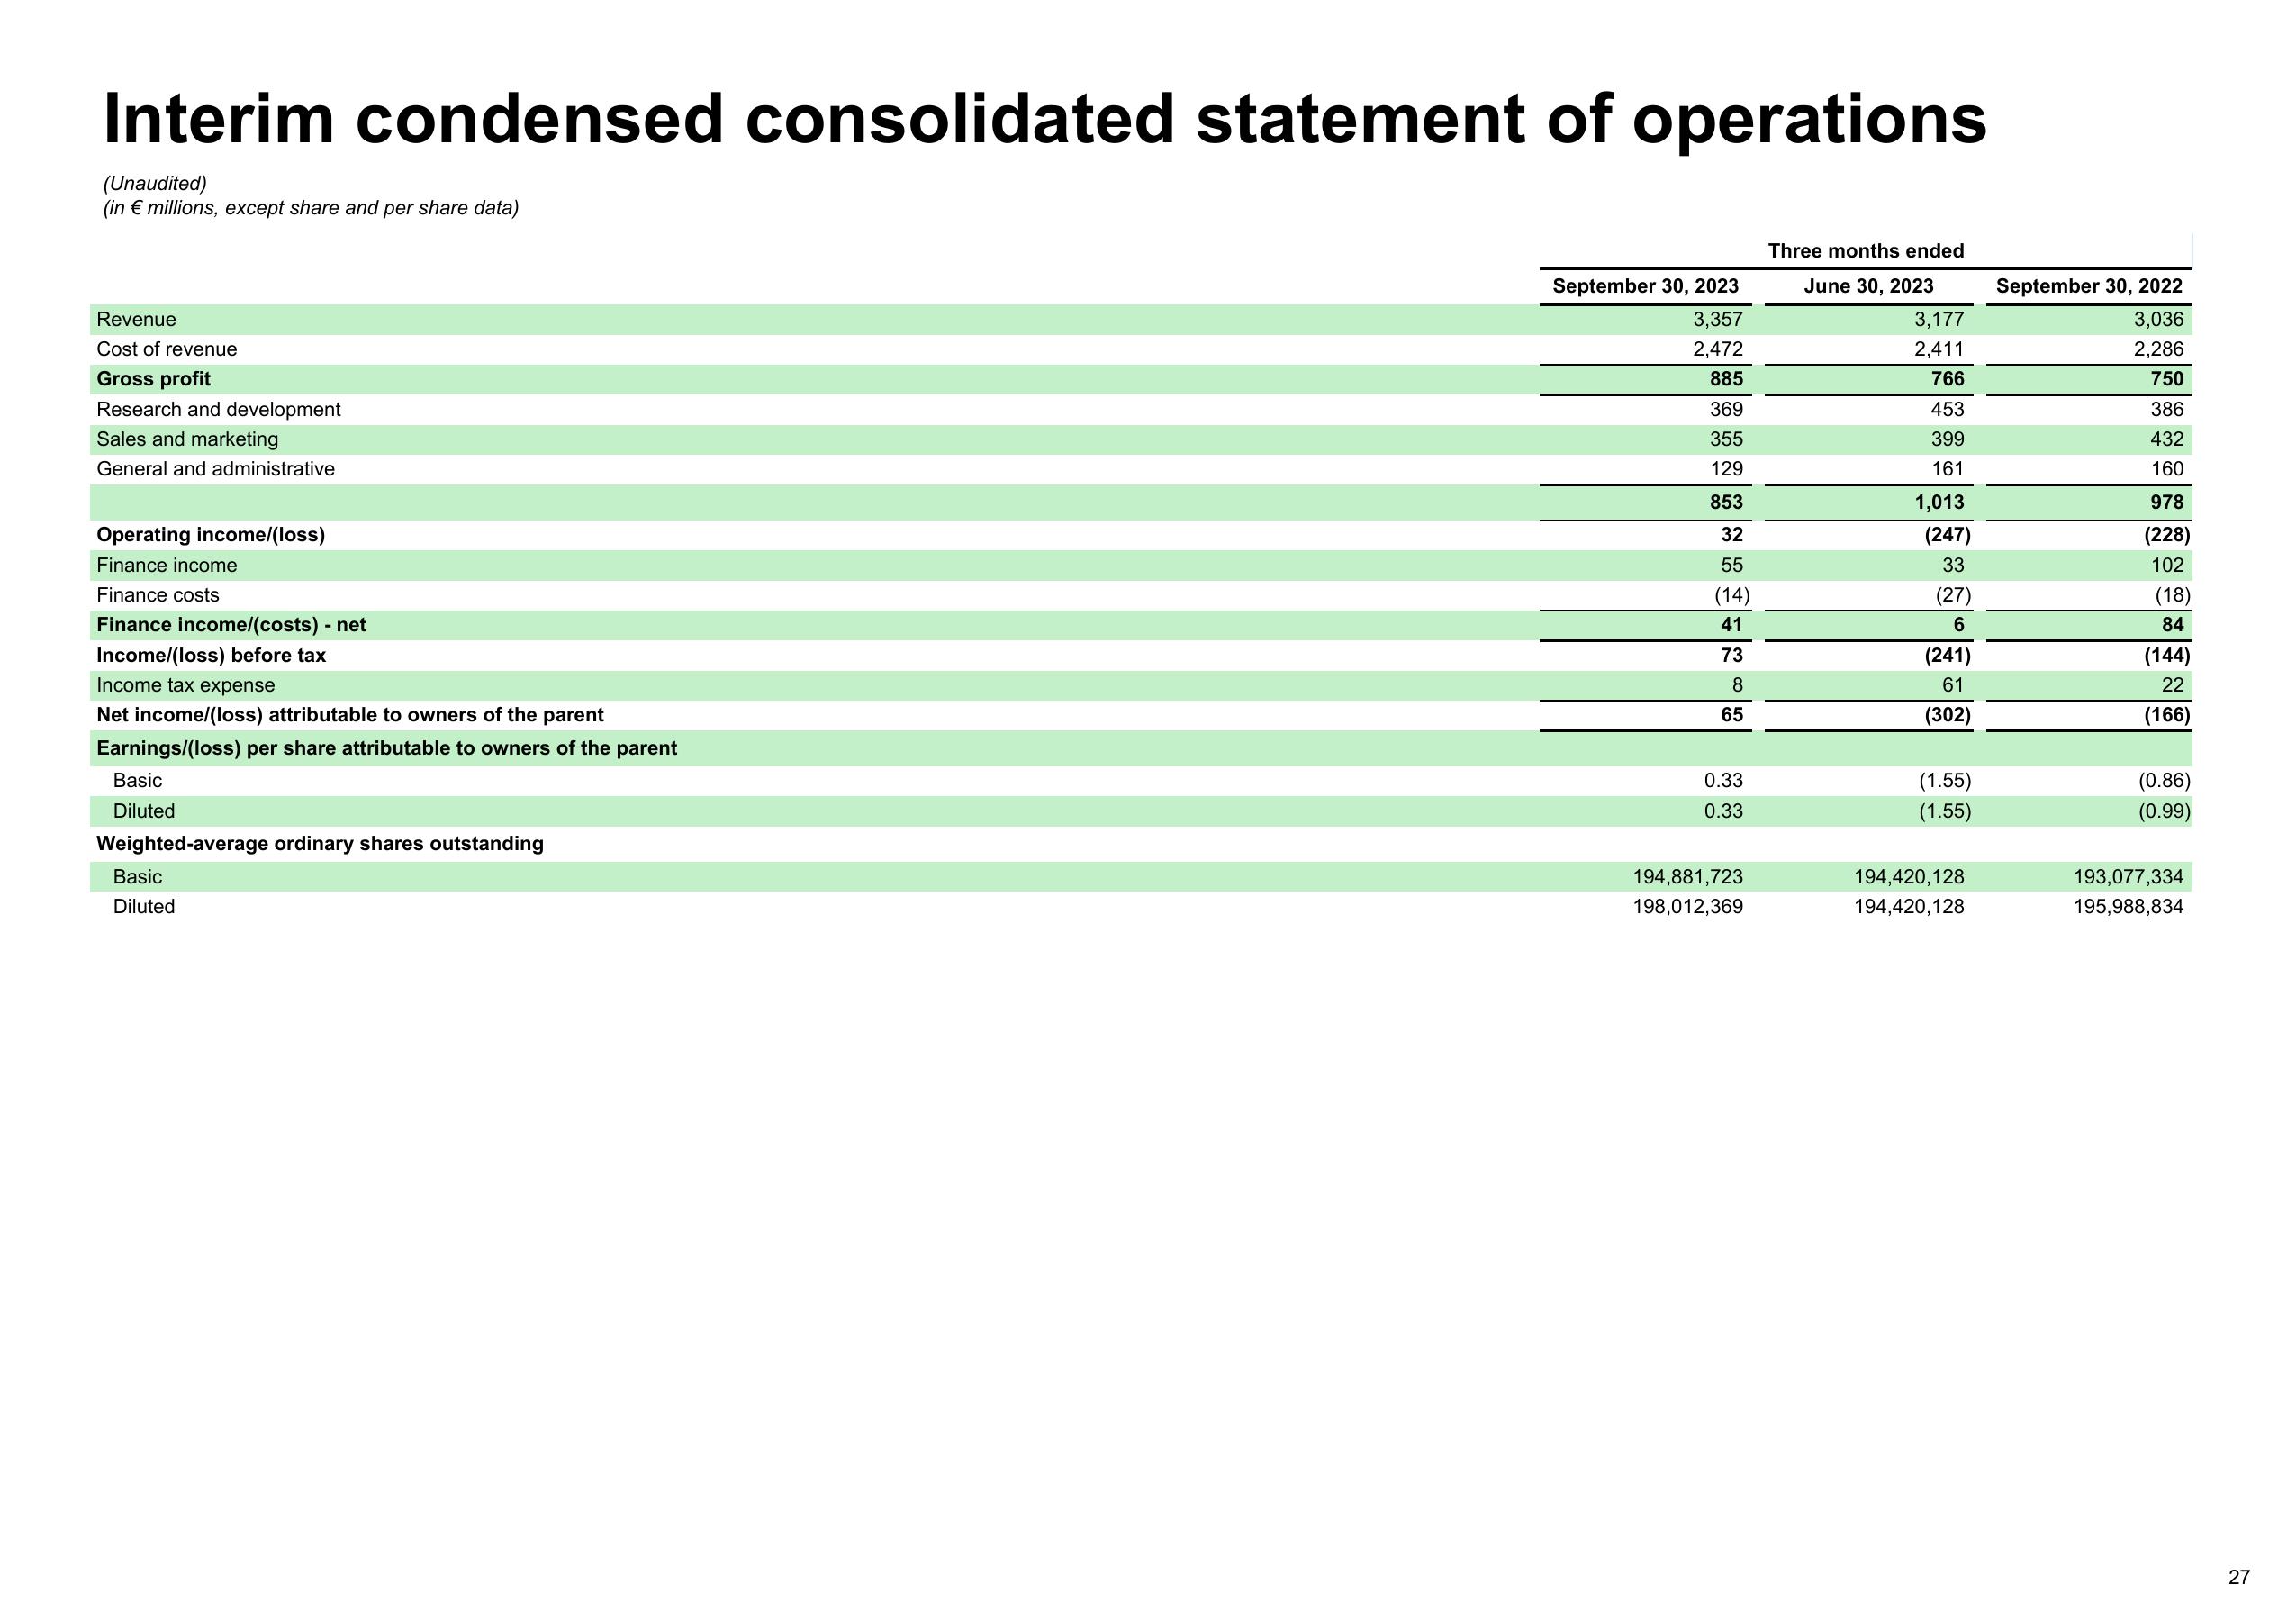
Interim condensed consolidated statement of operations
(Unaudited)
(in € millions, except share and per share data)
Revenue
Cost of revenue
Gross profit
Research and development
Sales and marketing
General and administrative
Operating income/(loss)
Finance income
Finance costs
Finance income/(costs) - net
Income/(loss) before tax
Income tax expense
Net income/(loss) attributable to owners of the parent
Earnings/(loss) per share attributable to owners of the parent
Basic
Diluted
Weighted-average ordinary shares outstanding
Basic
Diluted
September 30, 2023
3,357
2,472
885
369
355
129
853
32
55
(14)
41
73
8
65
0.33
0.33
194,881,723
198,012,369
Three months ended
June 30, 2023
3,177
2,411
766
453
399
161
1,013
(247)
33
(27)
6
(241)
61
(302)
(1.55)
(1.55)
194,420,128
194,420,128
September 30, 2022
3,036
2,286
750
386
432
160
978
(228)
102
(18)
84
(144)
22
(166)
(0.86)
(0.99)
193,077,334
195,988,834
27View entire presentation