Intertek Investor Conference Presentation Deck
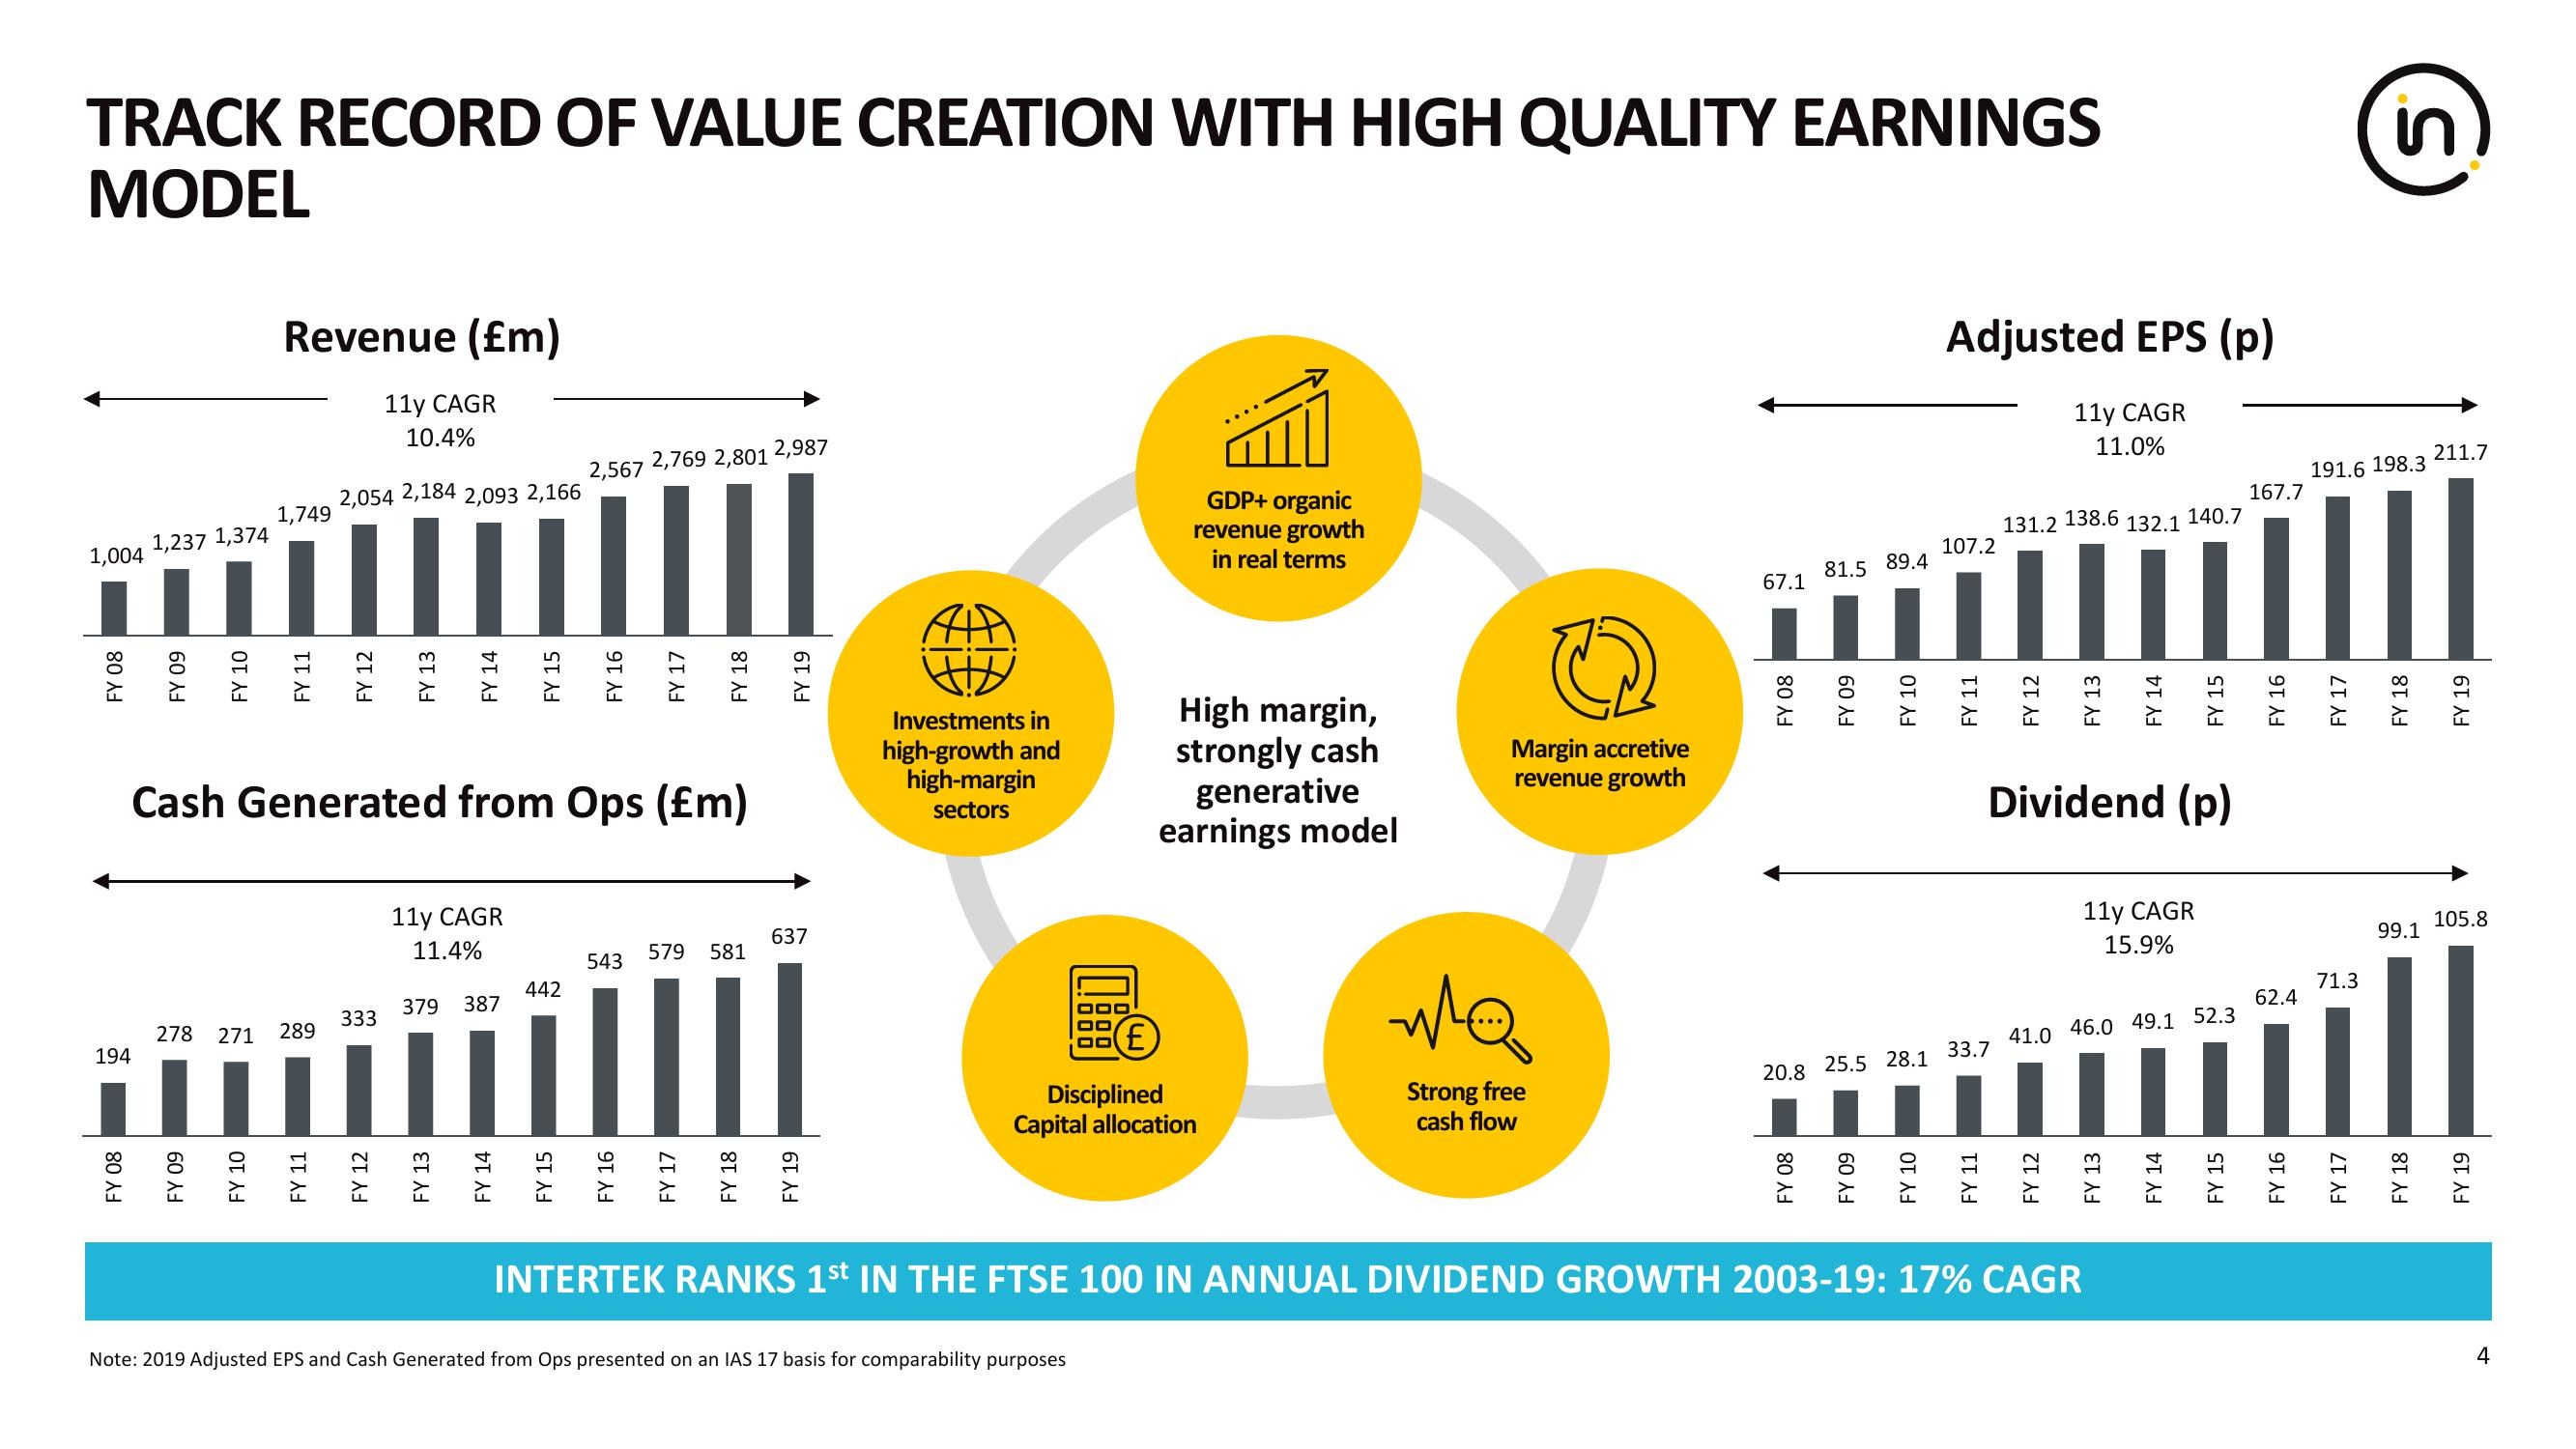
TRACK RECORD OF VALUE CREATION WITH HIGH QUALITY EARNINGS
MODEL
1,004
FY 08
194
FY 08
1,237
FY 09
1,374
FY 10
FY 09
278 271
Revenue (£m)
11y CAGR
10.4%
1,749
FY 11
2,567 2,769 2,801 2,987
2,054 2,184 2,093 2,166
11 IIII
289
FY 12
FY 13
333
FY 14
Cash Generated from Ops (£m)
11y CAGR
11.4%
379 387
FY 13
FY 15
FY 14
442
FY 16
FY 15
543
FY 17
FY 16
FY 18
579 581
FY 17
FY 18
FY 19
637
FY 19
APA
H
Investments in
high-growth and
high-margin
sectors
GDP+ organic
revenue growth
in real terms
High margin,
strongly cash
generative
earnings model
Disciplined
Capital allocation
Note: 2019 Adjusted EPS and Cash Generated from Ops presented on an IAS 17 basis for comparability purposes
Margin accretive
revenue growth
wa
Strong free
cash flow
67.1
FY 08
20.8
FY 08
81.5 89.4
FY 09
25.5
FY 09
FY 10
28.1
FY 10
Adjusted EPS (p)
11y CAGR
11.0%
107.2
138.6
132.1
140.7
....///
33.7
FY 11
131.2
FY 12
41.0
Dividend (p)
FY 12
FY 13
INTERTEK RANKS 1st IN THE FTSE 100 IN ANNUAL DIVIDEND GROWTH 2003-19: 17% CAGR
FY 14
11y CAGR
15.9%
46.0 49.1 52.3
FY 13
FY 15
FY 14
167.7
FY 15
FY 16
62.4
FY 16
191.6 198.3
FY 17
in
71.3
S
FY 17
FY 18
99.1
FY 18
211.7
FY 19
105.8
FY 19
4View entire presentation