jetBlue Investor Conference Presentation Deck slide image

jetBlue Investor Conference Presentation Deck

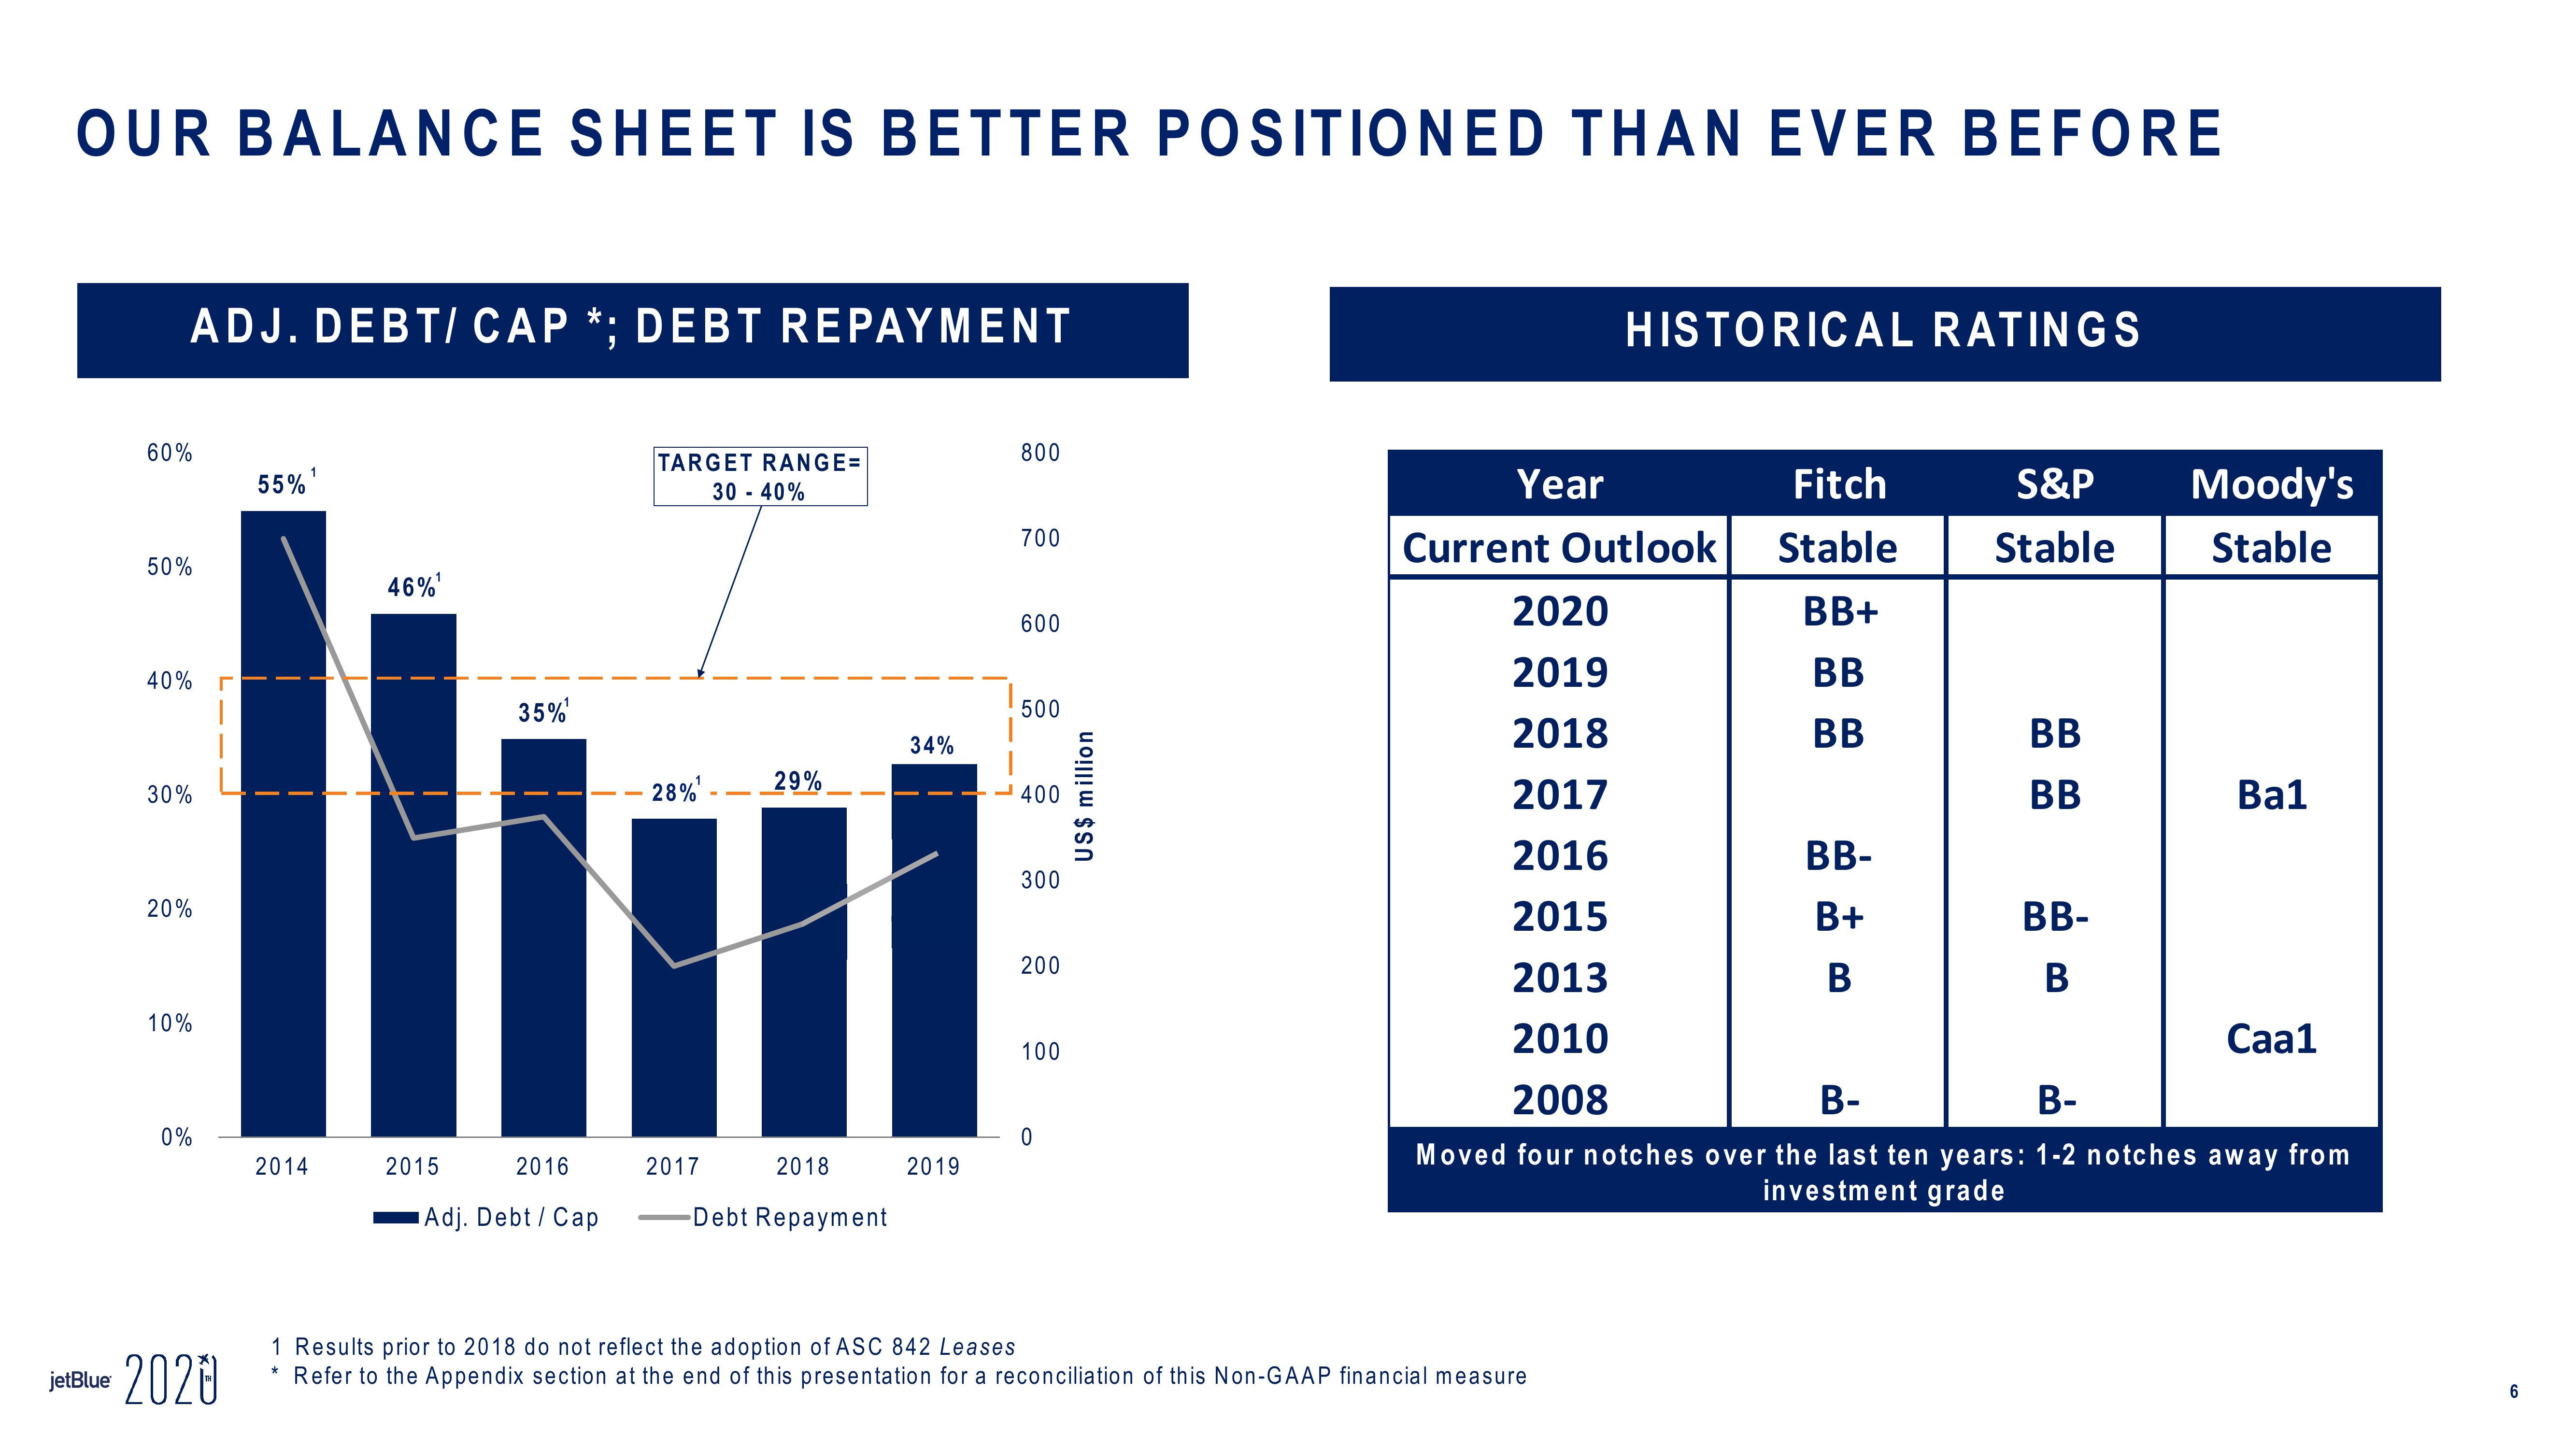
OUR BALANCE SHEET IS BETTER POSITIONED THAN EVER BEFORE ADJ. DEBT/CAP *; DEBT REPAYMENT 60% 50% 40% 30% 20% 10% 0% jetBlue 2020 55% 2014 46%¹ 35% 2015 2016 Adj. Debt / Cap TARGET RANGE= 28% 30-40% 2017 29% 2018 -Debt Repayment 34% 2019 800 700 600 500 <-400 300 200 100 0 US$ million Year Fitch Current Outlook Stable BB+ BB BB HISTORICAL RATINGS 1 Results prior to 2018 do not reflect the adoption of ASC 842 Leases Refer to the Appendix section at the end of this presentation for a reconciliation of this Non-GAAP financial measure S&P Stable 2020 2019 2018 2017 2016 2015 2013 2010 2008 B- B- Moved four notches over the last ten years: 1-2 notches away from investment grade BB- B+ B BB BB Moody's Stable BB- B Bal Caal 6
View entire presentation