Bed Bath & Beyond Results Presentation Deck
Q3 PERFORMANCE HIGHLIGHTS & TRANSFORMATION UPDATE
Q3 key takeaways
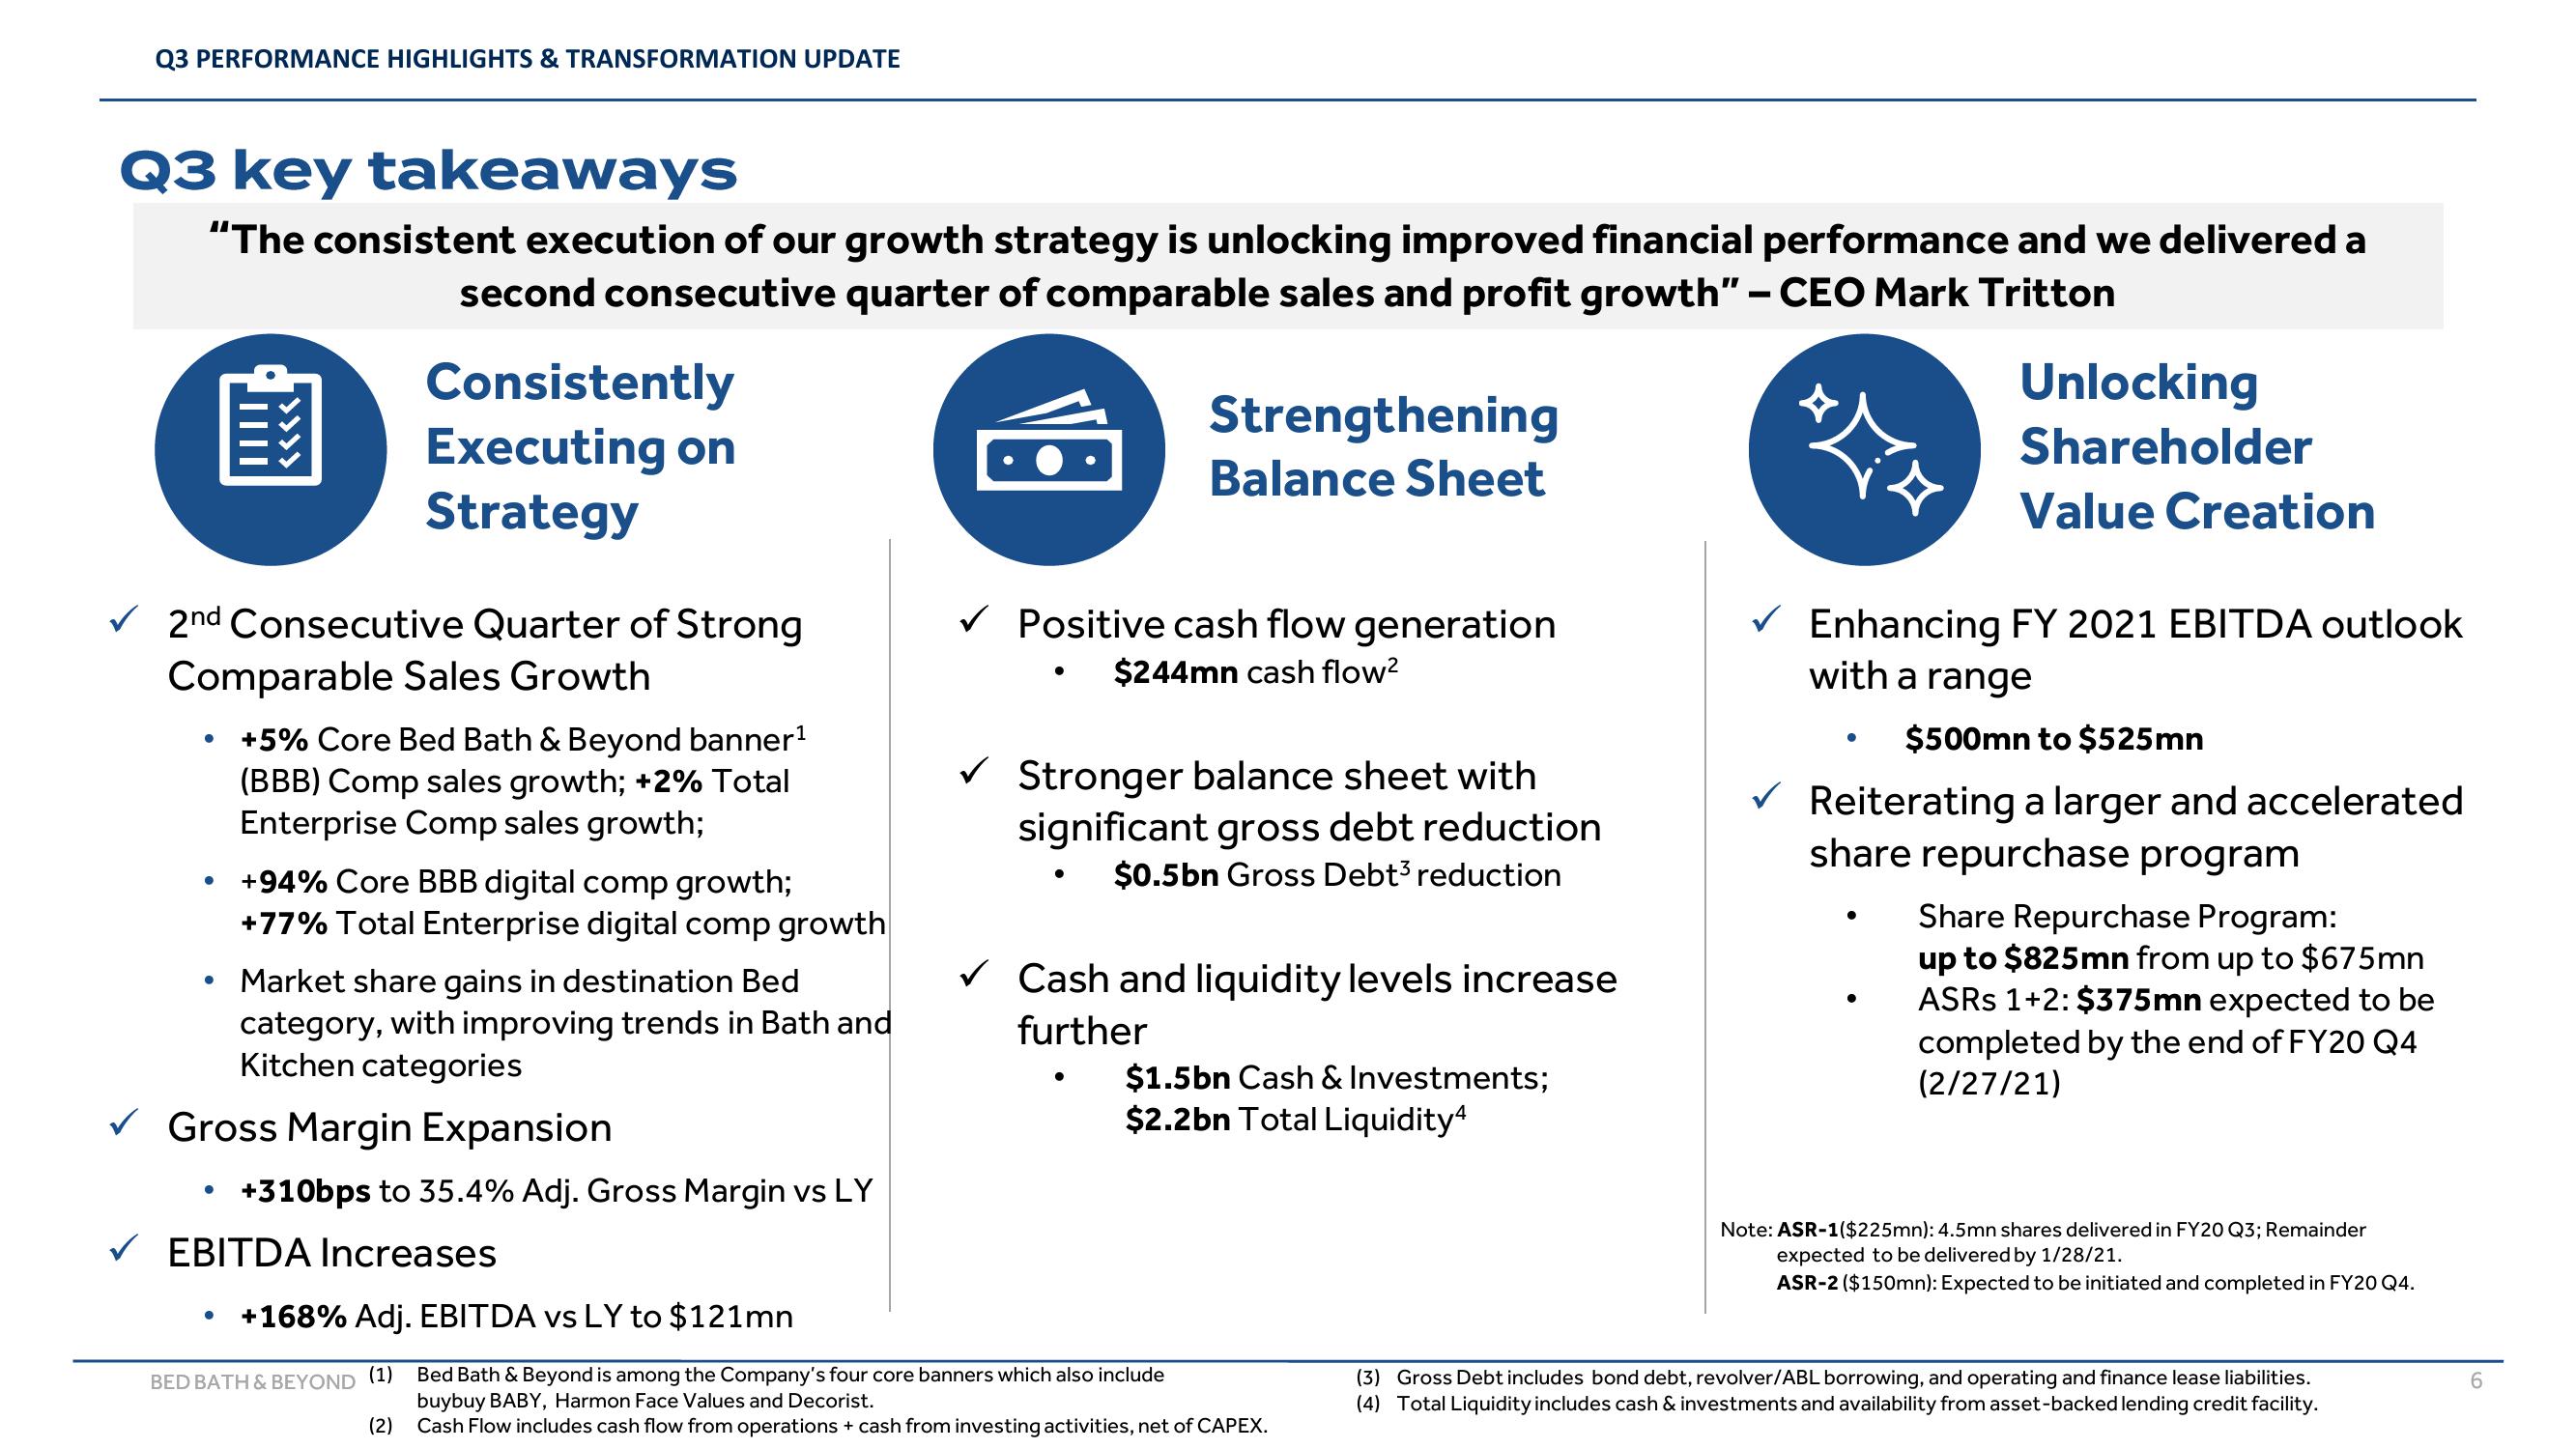
"The consistent execution of our growth strategy is unlocking improved financial performance and we delivered a
second consecutive quarter of comparable sales and profit growth" - CEO Mark Tritton
Consistently
Executing on
Strategy
2nd Consecutive Quarter of Strong
Comparable Sales Growth
●
+5% Core Bed Bath & Beyond banner¹
(BBB) Comp sales growth; +2% Total
Enterprise Comp sales growth;
+94% Core BBB digital comp growth;
+77% Total Enterprise digital comp growth
Market share gains in destination Bed
category, with improving trends in Bath and
Kitchen categories
✓ Gross Margin Expansion
+310bps to 35.4% Adj. Gross Margin vs LY
EBITDA Increases
• +168% Adj. EBITDA vs LY to $121mn
BED BATH & BEYOND (1)
(2)
Strengthening
Balance Sheet
✓ Positive cash flow generation
$244mn cash flow²
✓ Stronger balance sheet with
significant gross debt reduction
$0.5bn Gross Debt3 reduction
✓ Cash and liquidity levels increase
further
$1.5bn Cash & Investments;
$2.2bn Total Liquidity4
Bed Bath & Beyond is among the Company's four core banners which also include
buybuy BABY, Harmon Face Values and Decorist.
Cash Flow includes cash flow from operations + cash from investing activities, net of CAPEX.
¤×¤
Unlocking
Shareholder
Value Creation
✓Enhancing FY 2021 EBITDA outlook
with a range
$500mn to $525mn
✓ Reiterating a larger and accelerated
share repurchase program
Share Repurchase Program:
up to $825mn from up to $675mn
ASRs 1+2: $375mn expected to be
completed by the end of FY20 Q4
(2/27/21)
Note: ASR-1($225mn): 4.5mn shares delivered in FY20 Q3; Remainder
expected to be delivered by 1/28/21.
ASR-2 ($150mn): Expected to be initiated and completed in FY20 Q4.
(3) Gross Debt includes bond debt, revolver/ABL borrowing, and operating and finance lease liabilities.
(4) Total Liquidity includes cash & investments and availability from asset-backed lending credit facility.
6View entire presentation