J.P.Morgan Results Presentation Deck
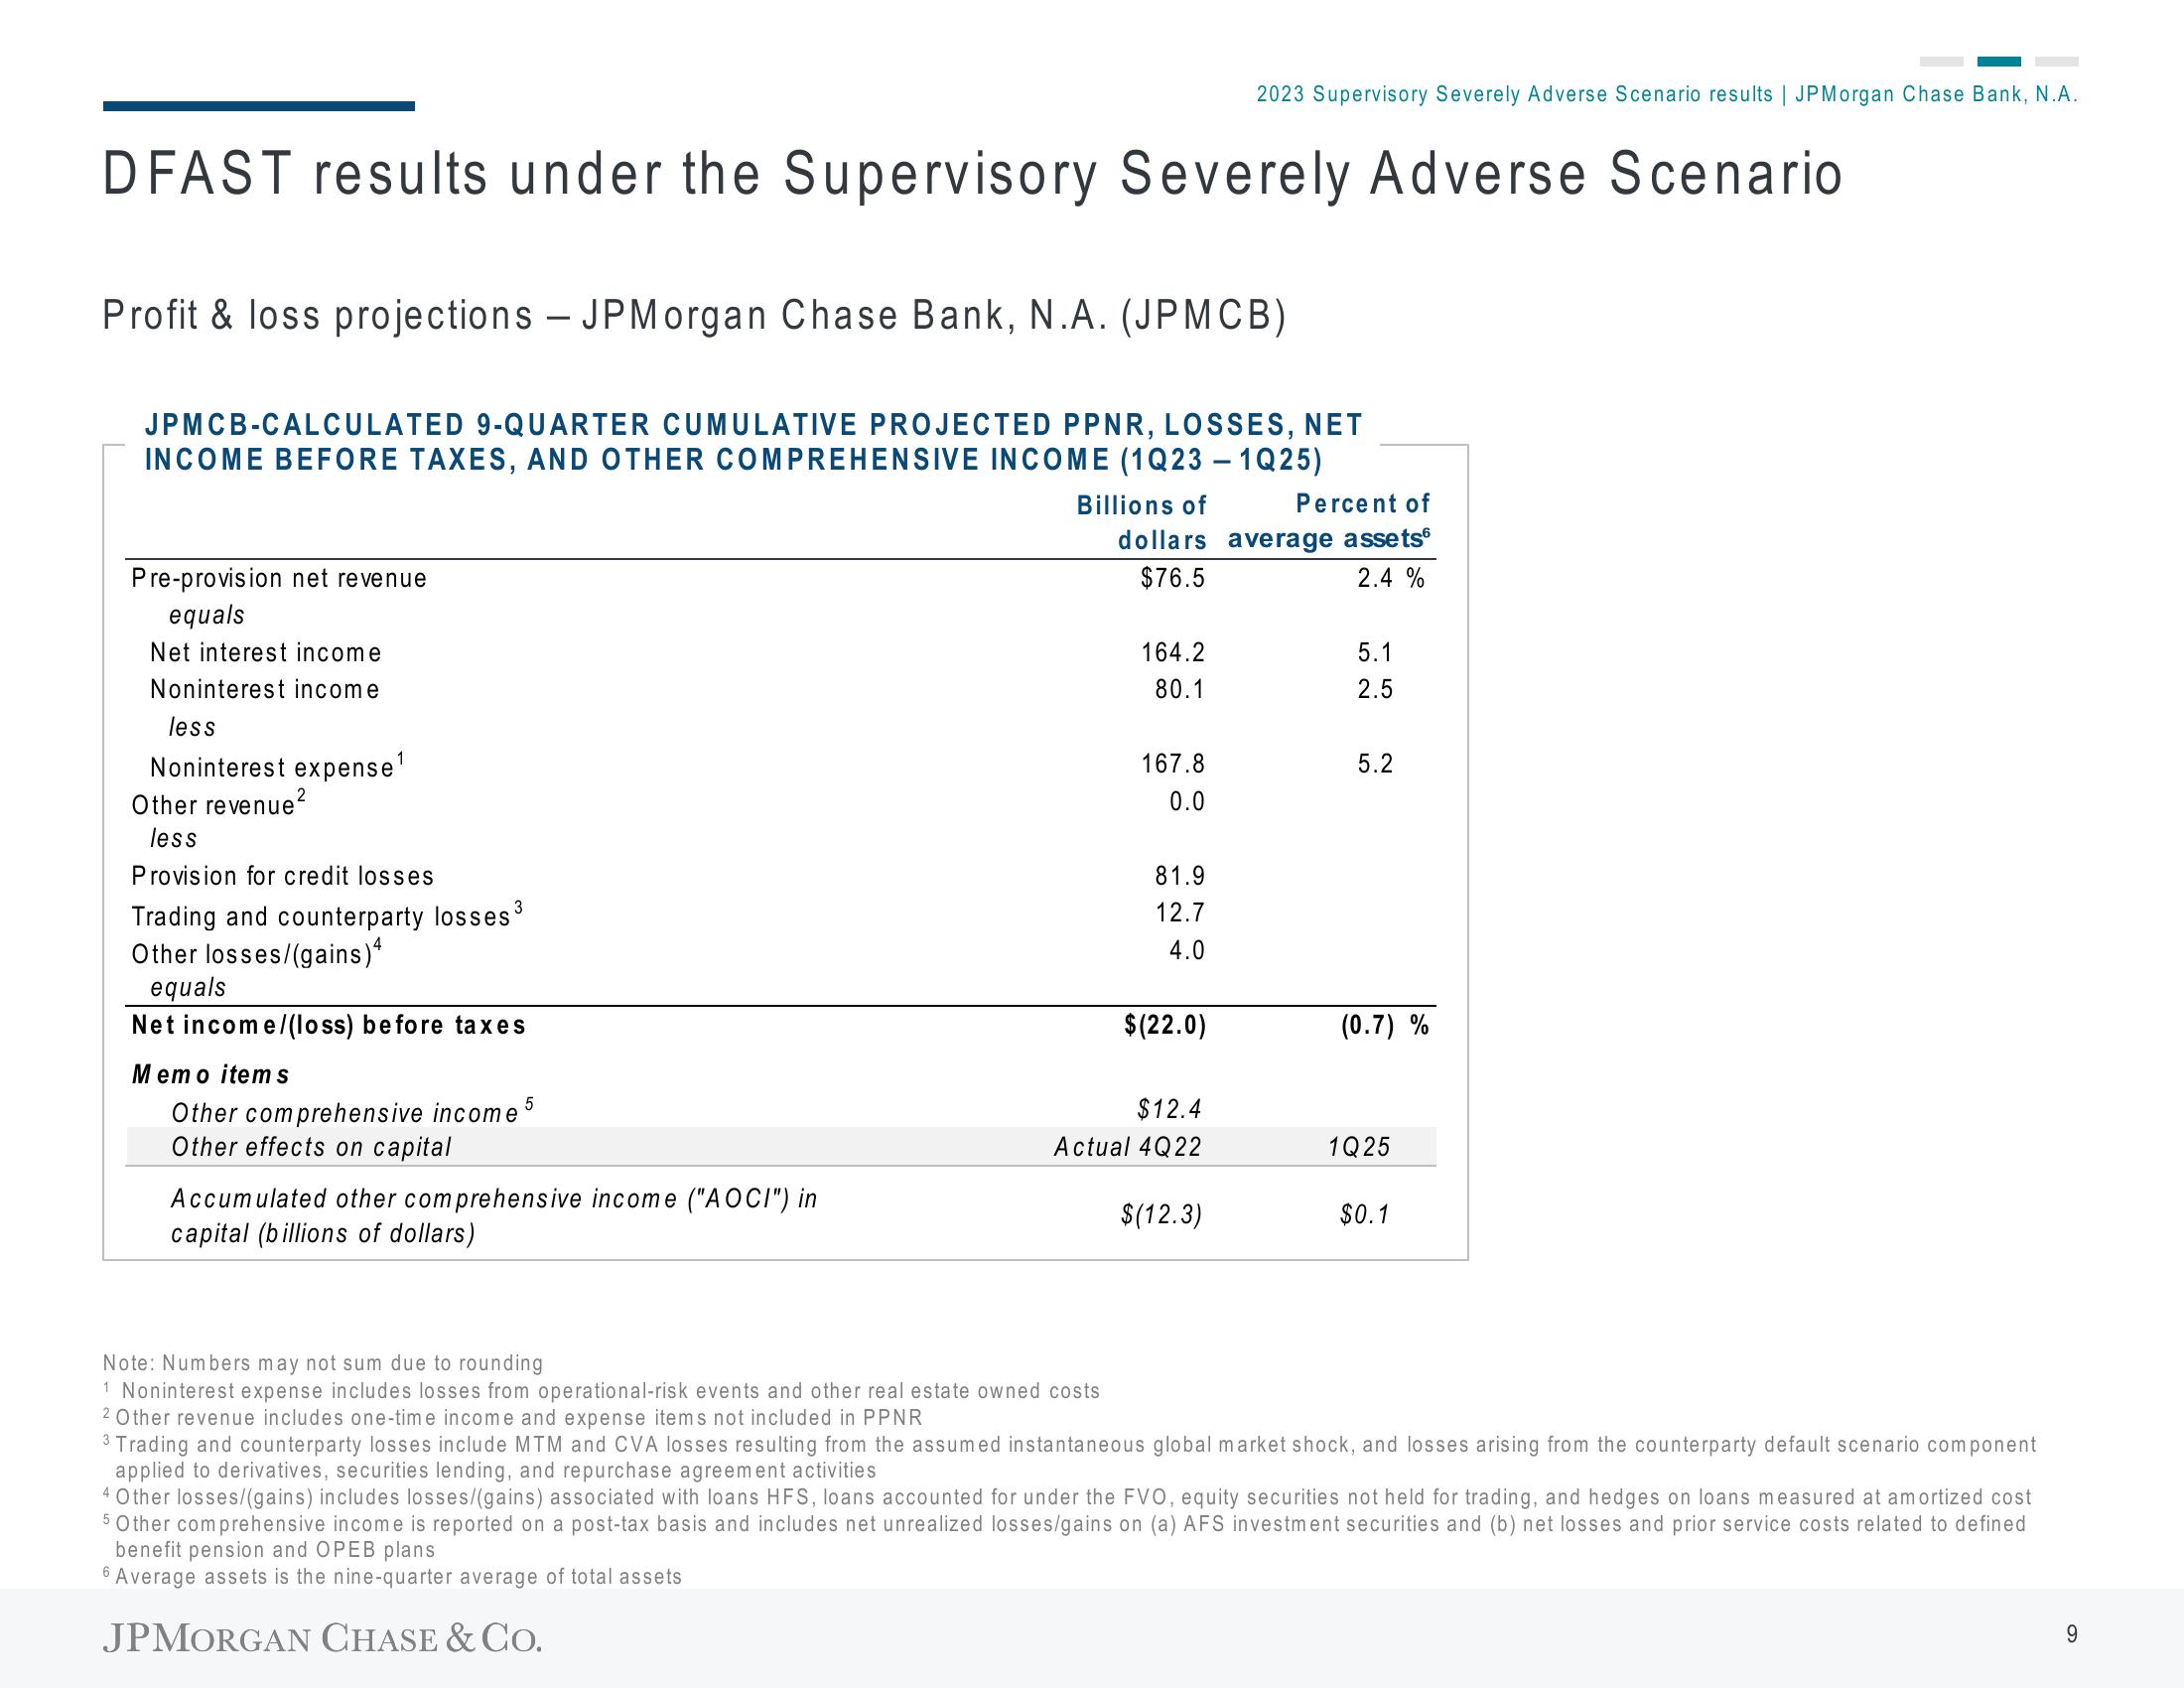
DFAST results under the Supervisory Severely Adverse Scenario
Profit & loss projections - JPMorgan Chase Bank, N.A. (JPMCB)
JPMCB-CALCULATED 9-QUARTER CUMULATIVE PROJECTED PPNR, LOSSES, NET
INCOME BEFORE TAXES, AND OTHER COMPREHENSIVE INCOME (1Q23 - 1Q25)
Billions of
Pre-provision net revenue
equals
Net interest income
Noninterest income
less
Noninterest expense¹
Other revenue²
less
Provision for credit losses
Trading and counterparty losses ³
Other losses/(gains) 4
equals
Net income/(loss) before taxes
Mem o items
Other comprehensive income 5
Other effects on capital
Accumulated other comprehensive income ("AOCI") in
capital (billions of dollars)
Note: Numbers may not sum due to rounding
1 Noninterest expense includes losses from operational-risk events and other real estate owned costs
2 Other revenue includes one-time income and expense items not included in PPNR
Percent of
dollars average assets
$76.5
2.4 %
164.2
80.1
167.8
0.0
2023 Supervisory Severely Adverse Scenario results | JPMorgan Chase Bank, N.A.
81.9
12.7
4.0
$(22.0)
$12.4
Actual 4Q22
$(12.3)
15
5.1
2.5
5.2
(0.7) %
1Q25
$0.1
3 Trading and counterparty losses include MTM and CVA losses resulting from the assumed instantaneous global market shock, and losses arising from the counterparty default scenario component
applied to derivatives, securities lending, and repurchase agreement activities
4 Other losses/(gains) includes losses/(gains) associated with loans HFS, loans accounted for under the FVO, equity securities not held for trading, and hedges on loans measured at amortized cost
5 Other comprehensive income is reported on a post-tax basis and includes net unrealized losses/gains on (a) AFS investment securities and (b) net losses and prior service costs related to defined
benefit pension and OPEB plans
6 Average assets is the nine-quarter average of total assets
JPMORGAN CHASE & CO.
9View entire presentation