UiPath IPO Presentation Deck
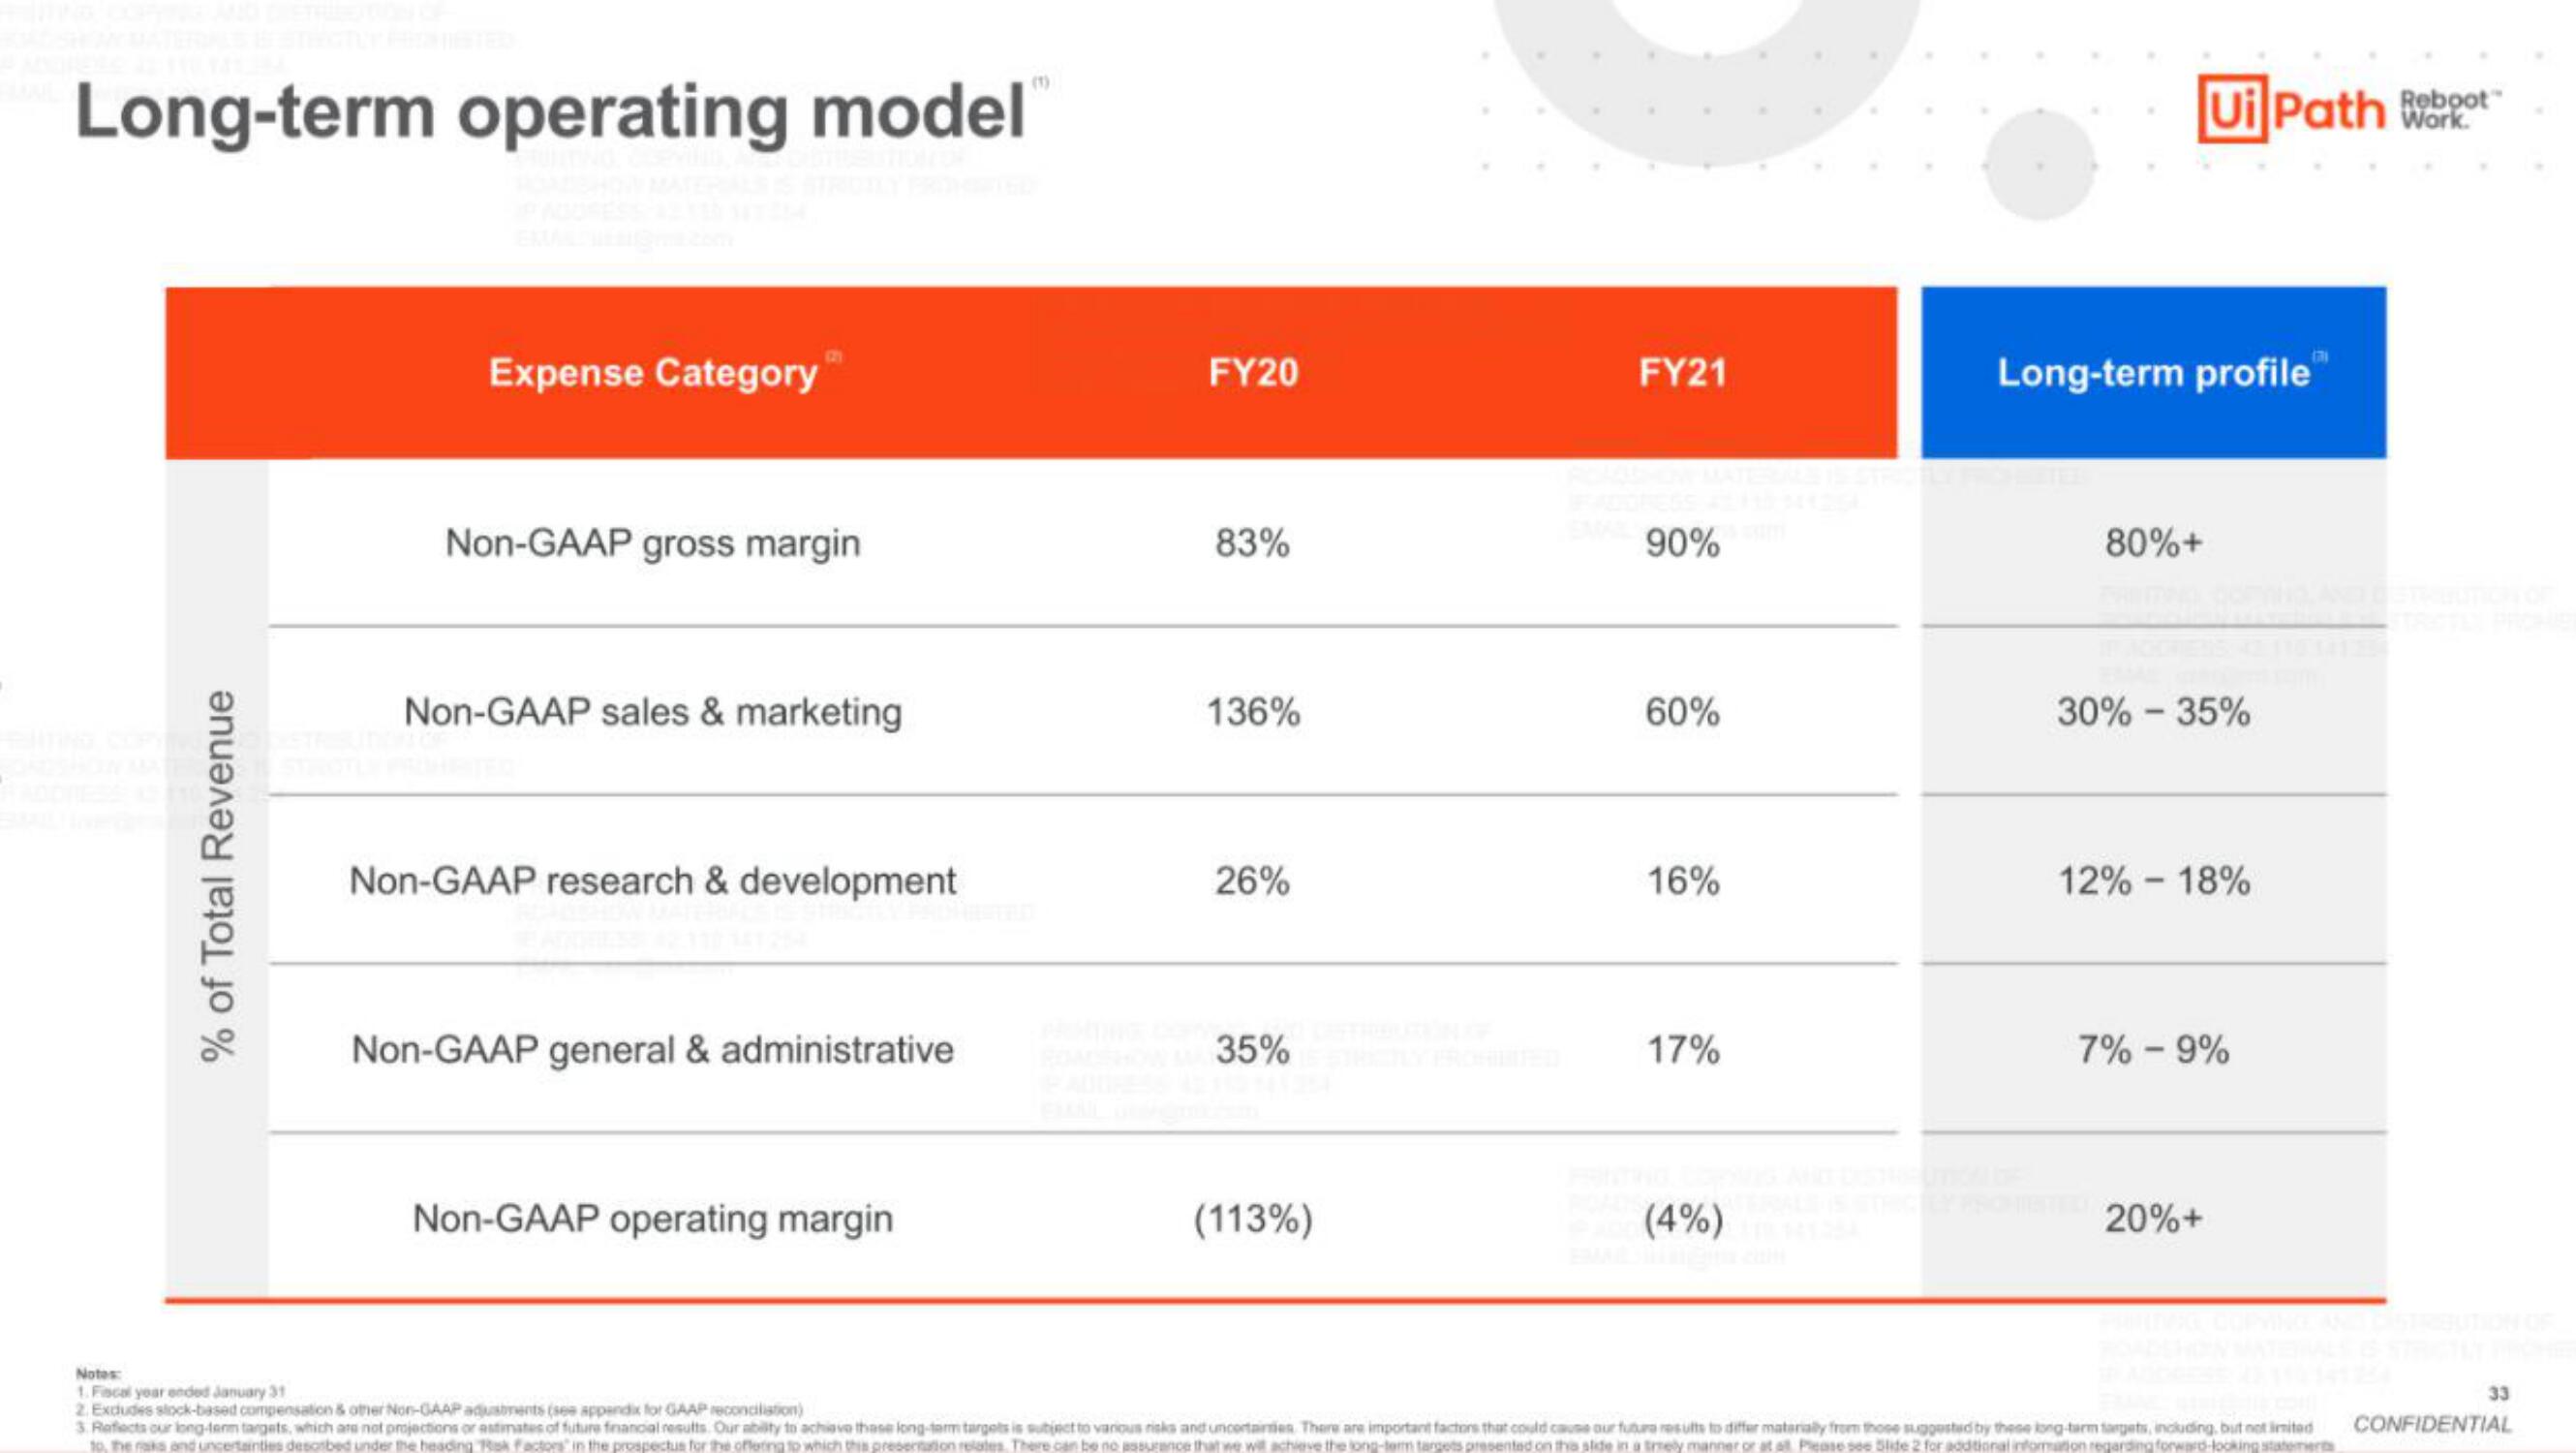
Long-term operating model
% of Total Revenue
Expense Category
Non-GAAP gross margin
Non-GAAP sales & marketing
Non-GAAP research & development
Non-GAAP general & administrative
Non-GAAP operating margin
FY20
83%
136%
26%
35%
(113%)
FY21
90%
60%
16%
17%
(4%)
Long-term profile"
80%+
Reboot
Ui Path Work
30%-35%
12% - 18%
7% -9%
20%+
Notes:
1. Fiscal year ended January 31
2. Excudes stock-based compensation & other Non-GAAP adjustments (see appendix for GAAP reconciliation)
3. Reflects our long-term targets, which are not projections or astimates of future financial results. Our ability to achieve thase long-term targets is subject to various risks and uncertainties. There are important factors that could cause our future results to differ materially from those suggested by these long-term targets, including, but not limited
to the raks and uncertainties desorbed under the heading Risk factors in the prospectus for the offering to which this presentation relates. There can be no assurance that we will achieve the long-term targets presented on the slide in a tmely manner or at all Please see Slide 2 for additional information regarding forward-looking statements
33
CONFIDENTIALView entire presentation