Solar Industry Update
Planned U.S. Electric Generation Plants in
Relation to Energy Communities
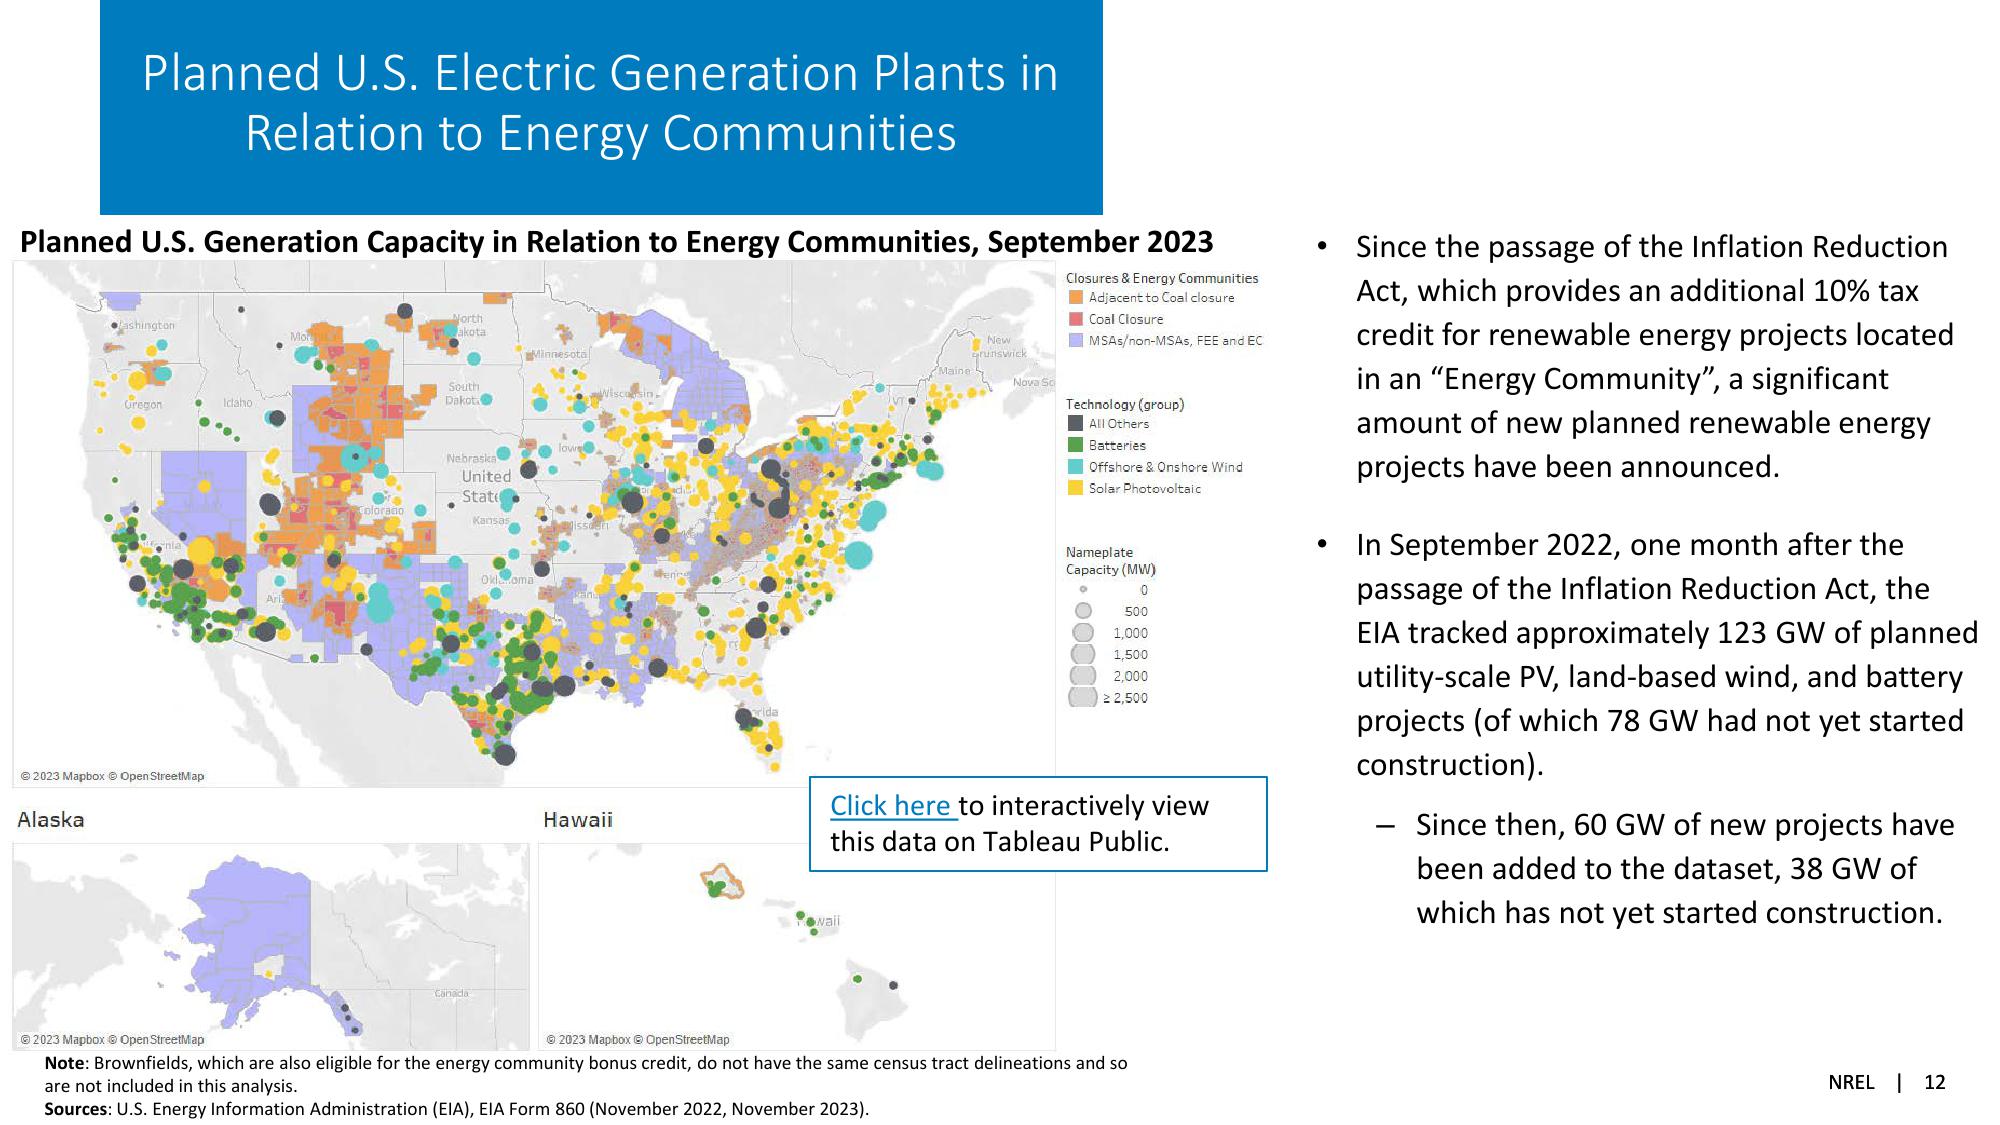
Planned U.S. Generation Capacity in Relation to Energy Communities, September 2023
ashington
North
akota
Minnesota
Gregon
° Idaho
South
Dakot
© 2023 Mapbox © OpenStreetMap
Alaska
.
olorado
Nebraska
United
State
Kansas
New
grunswick
Maine
Nova Sc
Closures & Energy Communities
Adjacent to Coal closure
Coal Closure
MSAs/non-MSAS, FEE and EC
Technology (group)
All Others
Batteries
Offshore & Onshore Wind
Solar Photovoltaic
Nameplate
Capacity (MW)
Okloma
en
о
0
500
1,000
1,500
2,000
≥ 2,500
Hawaii
Click here to interactively view
this data on Tableau Public.
•
Since the passage of the Inflation Reduction
Act, which provides an additional 10% tax
credit for renewable energy projects located
in an "Energy Community", a significant
amount of new planned renewable energy
projects have been announced.
In September 2022, one month after the
passage of the Inflation Reduction Act, the
EIA tracked approximately 123 GW of planned
utility-scale PV, land-based wind, and battery
projects (of which 78 GW had not yet started
construction).
Since then, 60 GW of new projects have
been added to the dataset, 38 GW of
which has not yet started construction.
Canada
Nail
2023 Mapbox © OpenStreetMap
© 2023 Mapbox © OpenStreetMap
Note: Brownfields, which are also eligible for the energy community bonus credit, do not have the same census tract delineations and so
are not included in this analysis.
Sources: U.S. Energy Information Administration (EIA), EIA Form 860 (November 2022, November 2023).
NREL 12View entire presentation