Bank of America Investment Banking Pitch Book
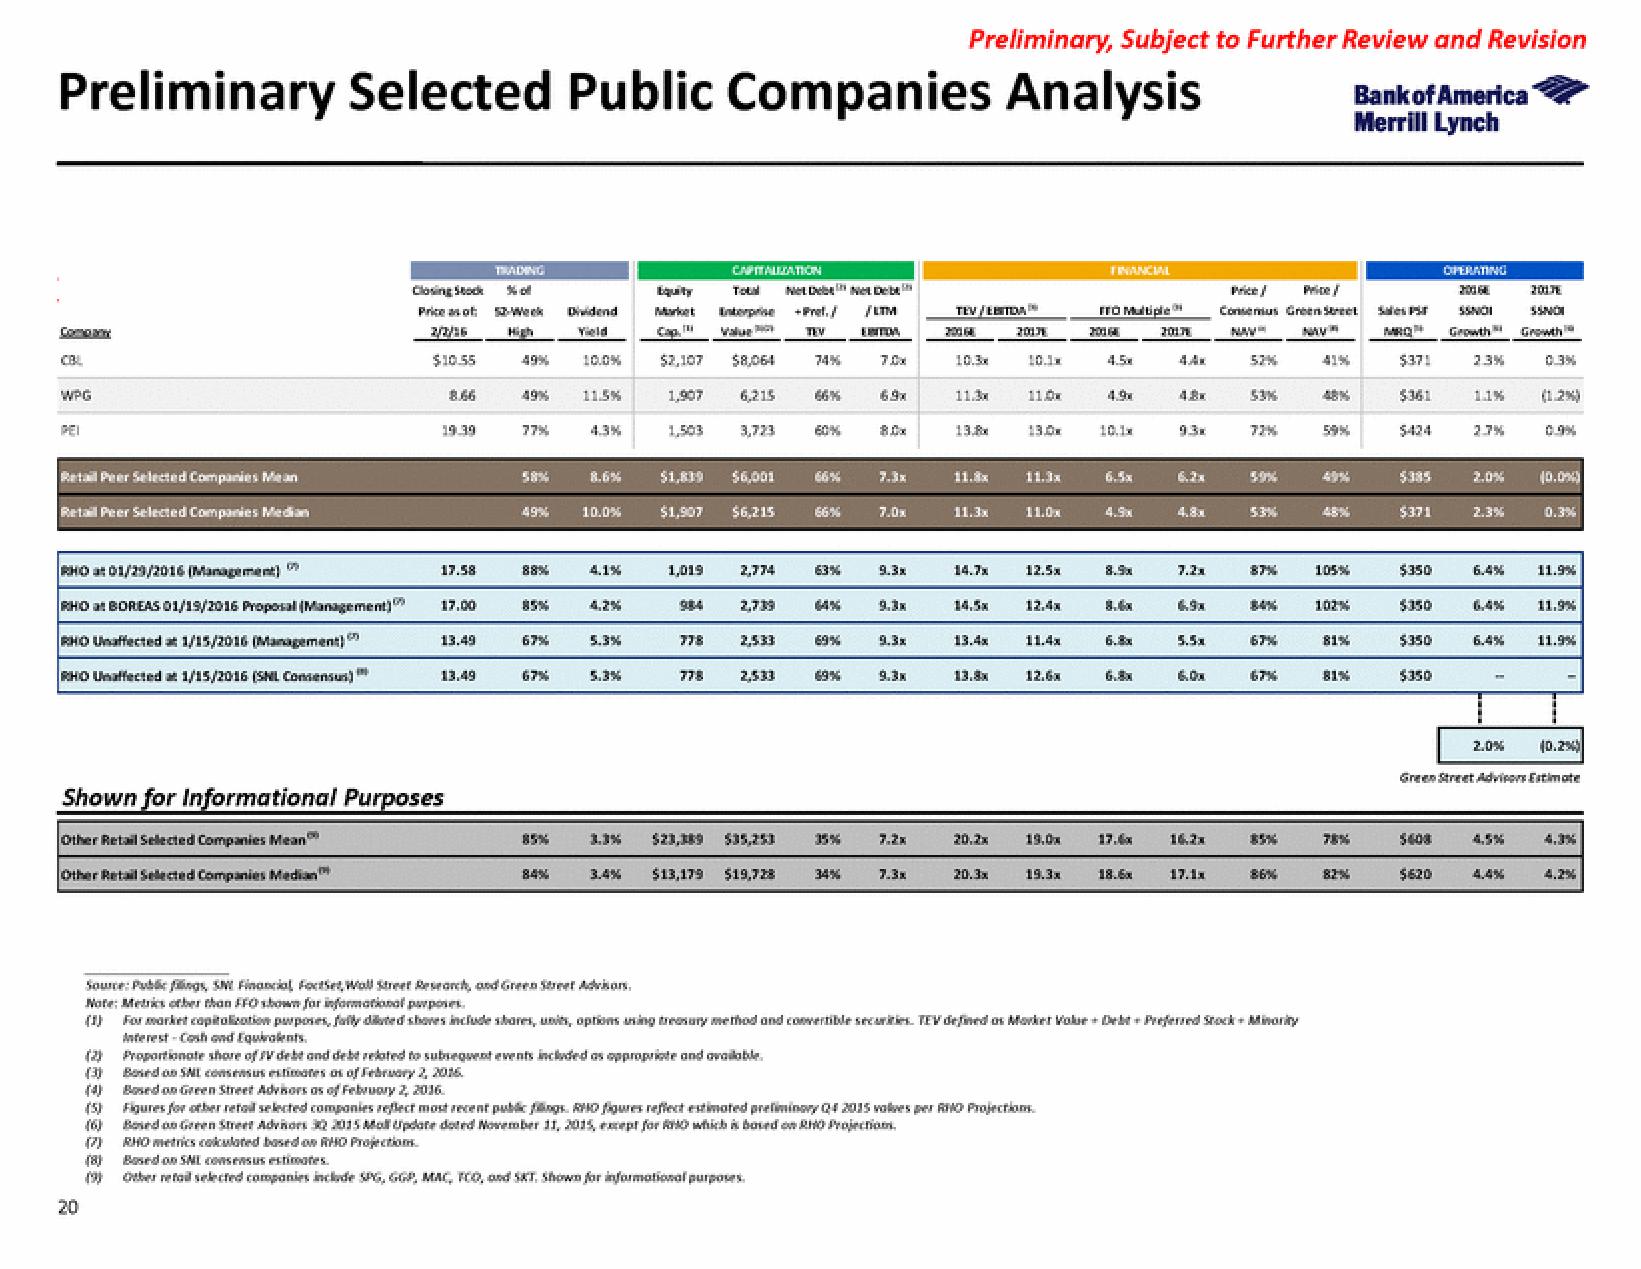
Preliminary Selected Public Companies Analysis
WPG
PEI
Retail Peer Selected Companies Mean
Retail Peer Selected Companies Median
RHO at 01/29/2016 (Management)
RHO at BOREAS 01/19/2016 Proposal (Management)
RHO Unaffected at 1/15/2016 (Management)
RHO Unaffected at 1/15/2016 (SNL Consensus)
20
8888888
Closing Stock
Price as of 52-Week
$10.55
19.39
(4)
17.58
17.00
Shown for Informational Purposes
Other Retail Selected Companies Mean
Other Retail Selected Companies edian
13.49
13.49
TRAINING
(3) Bosed on SAL consensus estimates os of February 2, 2016.
Based on Green Street Advisors as of February 2, 2016.
49%
49%
77%
49%
88%
67%
67%
85%
Dividend
Yield
11.5%
4.3%
8.6%
10.0%
4,2%
5.3%
1.3%
Lqualty
Market
$2,107
1,907
1,503
1,019
984
378
CAPITALIZATION
778
Tou
Enterprise
$1,839
$6,001
$1,907 $6,215
$8,064
6,215
3,723
2,774
2,739
2,533
2,533
$23,389 $35,253
$13,179 $19,728
Net DebNet Deb
+ Pref./ /LTM
TEV
ERITOA
74%
(8) Based on SNL consensus estimates.
Other retail selected companies include SPG, GGP, MAC, PCO, and SKT. Shown for informational purposes.
66%
63%
64%
69%
69%
15%
34%
7.0x
80x
7.0x
9.3x
9.3x
9.3x
7.2x
Preliminary, Subject to Further Review and Revision
Bank of America
Merrill Lynch
7.3x
TEV/EBITDA
30164
10.3x
11.3x
13.8
11.8x
11.3x
13.4x
13.8x
20.2x
20131
1.3x
10.1M
11.0x
14.7x 129
13.0x
11.3x
11.0x
12.4x
11.4x
12.6x
19.0x
19.3x
(5) Figures for other retail selected companies reflect most recent public fogs. RHO figures reflect estimated preliminary Q4 2015 volves per RO Projections
Based on Green Street Advisors 32 2015 Moll Update doted November 11, 2015, except for which is based on RHO Projections.
(7) RHO metrics colculated based on RHD Projection.
FINANCIAL
FFO Multiple
2014
4.5
4.9
10.1
4.5x
8.9x
6.8x
6.8x
17.4x
18.6x
20171
4.4.
4.8
7.2x
5.5x
6.0x
16.3x
Consemus Green Street
MW
NAV
53%
72%
59%
87%
Source: Public filings, SM Financial Foctet Wall Street Research, and Green Street Advisors.
Note: Metrics other than FFO shown for informational purposes.
(1) For market capitalization purposes, Jally diluted shoves include shares, units, options using treasury method and convertible securities. TEV defined as Market Volur + Debt+ Preferred Stock+ Minority
Interest-Cash and Equivalents.
(3) Proportionate shore of IV debe and debt related to subsequent events included as appropriate and available.
84%
67%
85%
86%
59%
49%
105%
102%
81%
78%
825
Sales Pr
MRO
$371
$361
$424
$371
$350
$350
$350
$350
OPERATING
20160
SSNOI
Growth
$620
2.3%
2.0%
2.3%
6.4%
6,4%
6.4%
2.0%
2017
SSNOI
Growth
0.3%
(1.2%)
(0.0%)
0.3%
11.9%
11.9%
11.9%
(0.2%)
Green Street Advisors Estimate
4.3%
4.2%View entire presentation