DrivenBrands Results Presentation Deck
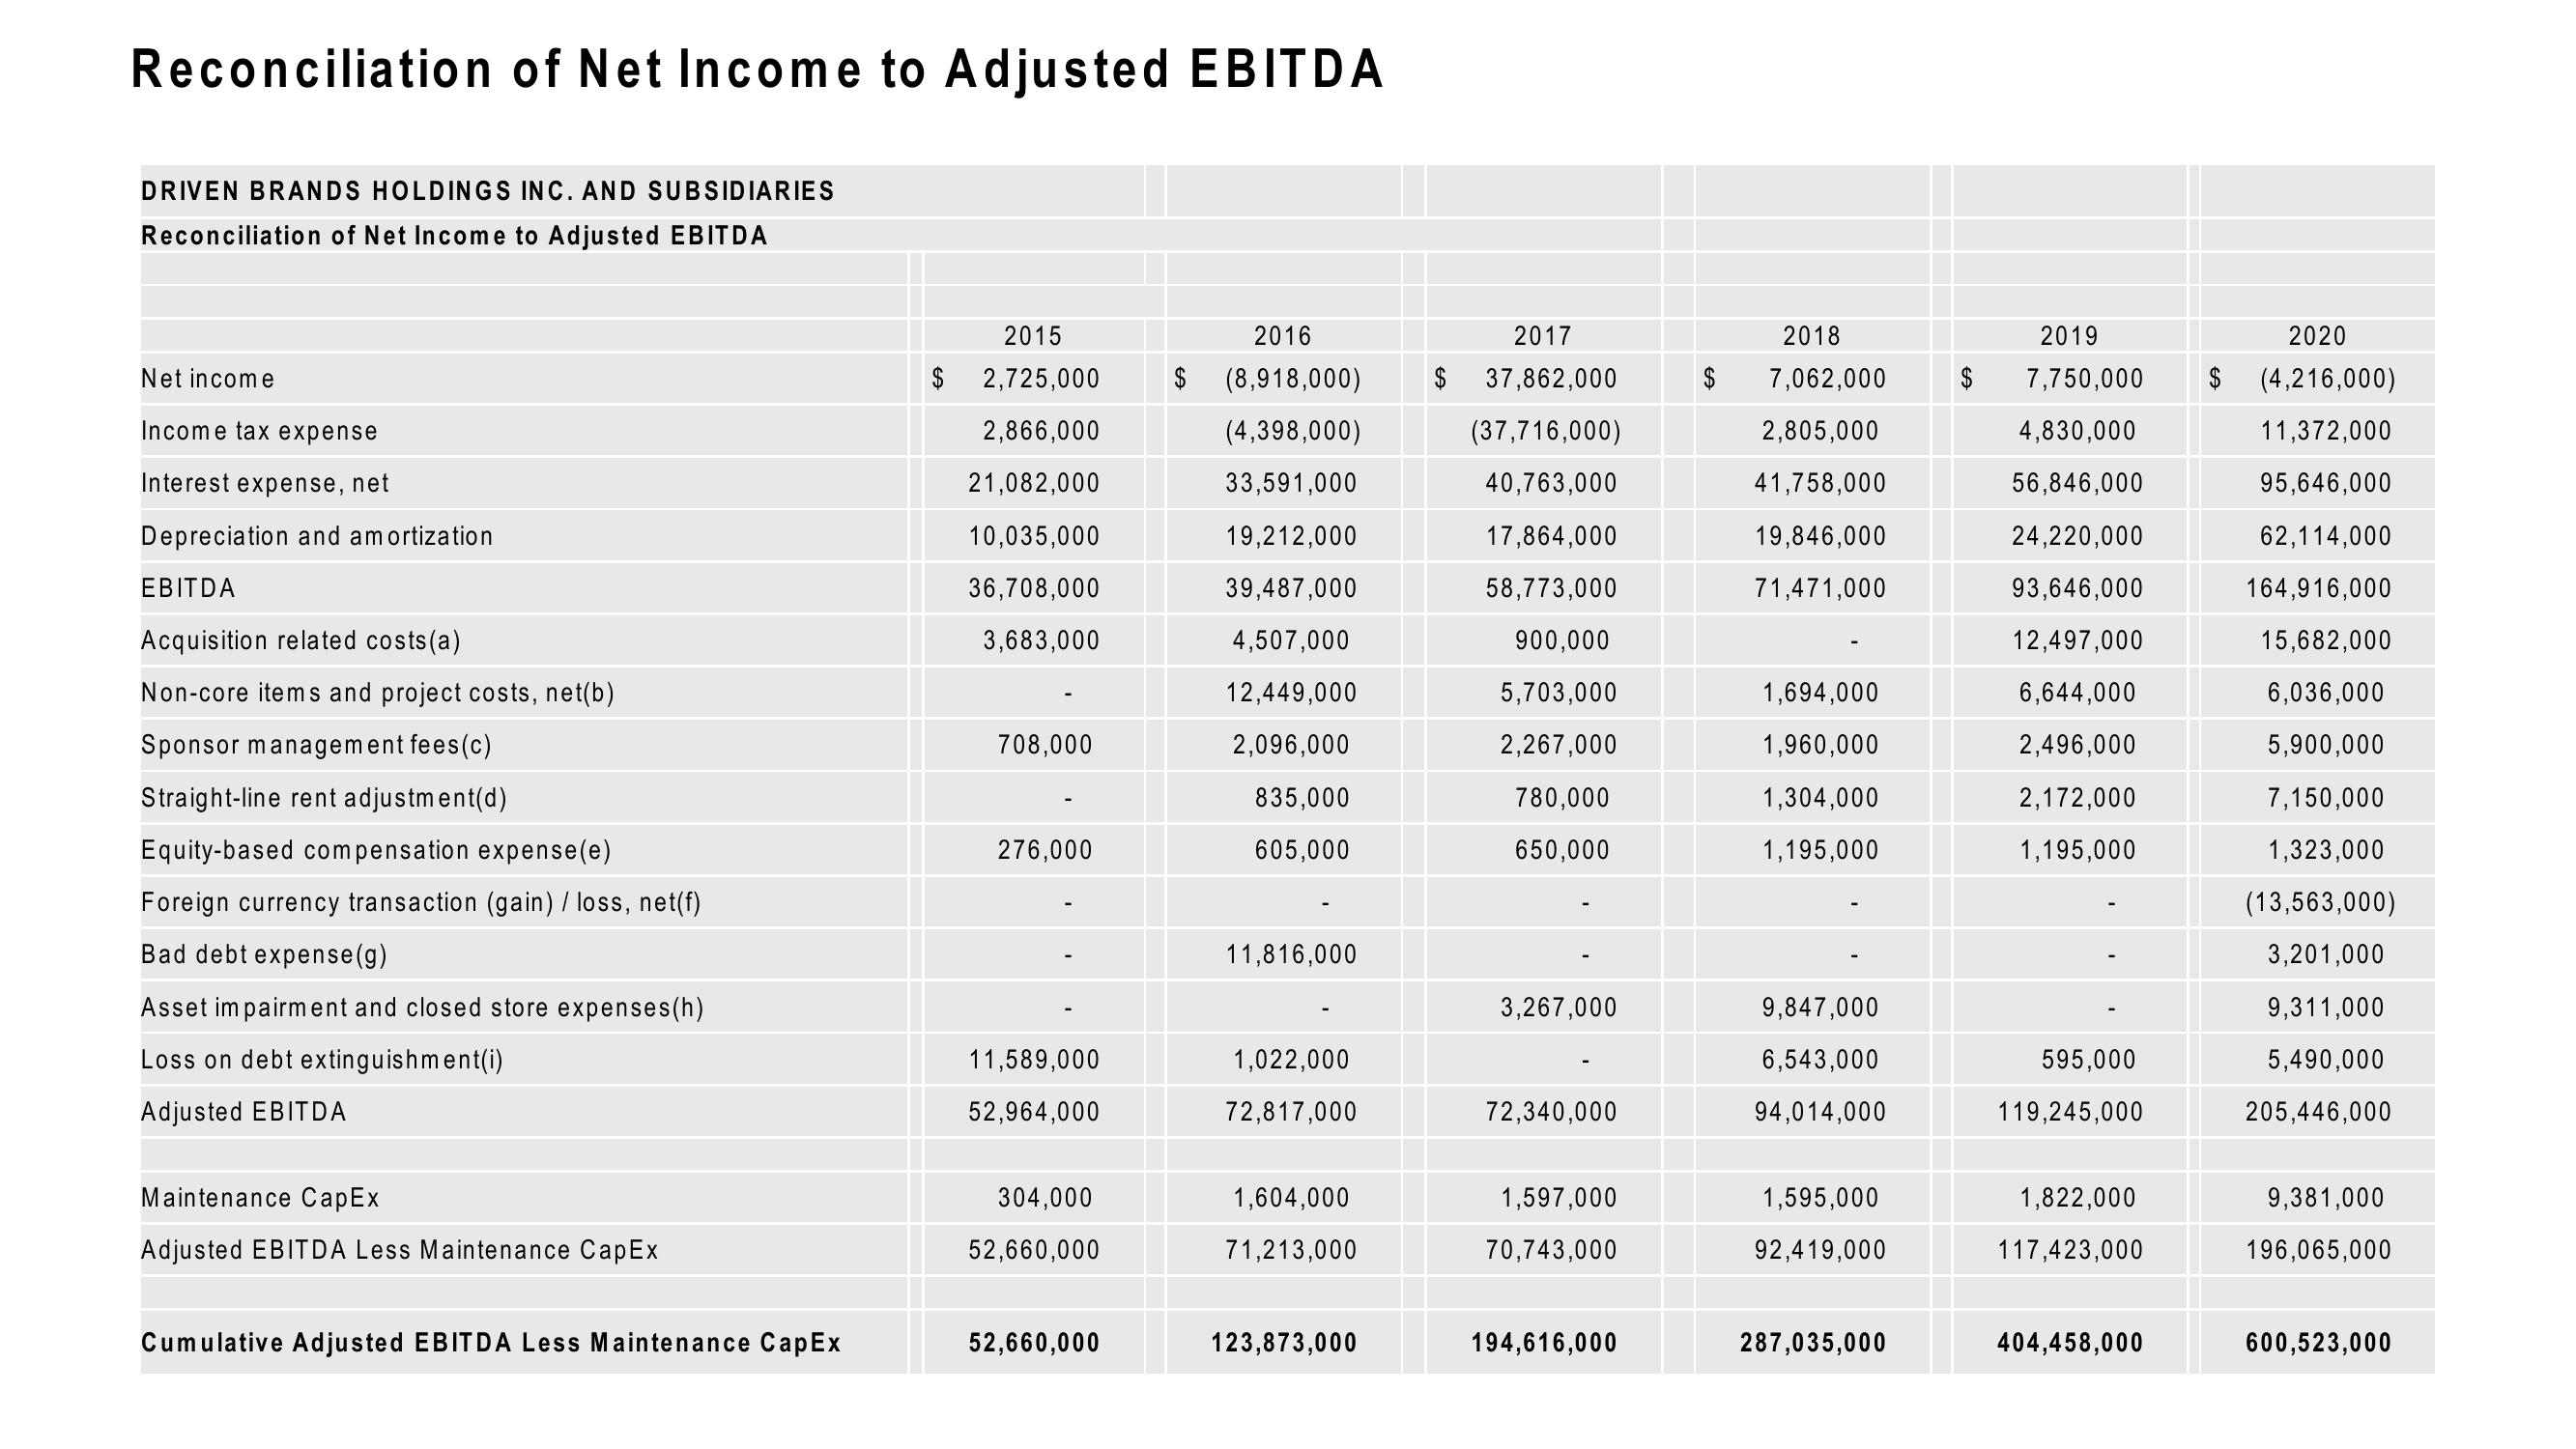
Reconciliation of Net Income to Adjusted EBITDA
DRIVEN BRANDS HOLDINGS INC. AND SUBSIDIARIES
Reconciliation of Net Income to Adjusted EBITDA
Net income
Income tax expense
Interest expense, net
Depreciation and amortization
EBITDA
Acquisition related costs(a)
Non-core items and project costs, net(b)
Sponsor management fees (c)
Straight-line rent adjustment(d)
Equity-based compensation expense(e)
Foreign currency transaction (gain) / loss, net(f)
Bad debt expense(g)
Asset impairment and closed store expenses(h)
Loss on debt extinguishment(i)
Adjusted EBITDA
Maintenance CapEx
Adjusted EBITDA Less Maintenance CapEx
Cumulative Adjusted EBITDA Less Maintenance CapEx
$
2015
2,725,000
2,866,000
21,082,000
10,035,000
36,708,000
3,683,000
708,000
276,000
11,589,000
52,964,000
304,000
52,660,000
52,660,000
2016
$ (8,918,000)
(4,398,000)
33,591,000
19,212,000
39,487,000
4,507,000
12,449,000
2,096,000
835,000
605,000
11,816,000
1,022,000
72,817,000
1,604,000
71,213,000
123,873,000
2017
$ 37,862,000
(37,716,000)
40,763,000
17,864,000
58,773,000
900,000
5,703,000
2,267,000
780,000
650,000
3,267,000
72,340,000
1,597,000
70,743,000
194,616,000
$
2018
7,062,000
2,805,000
41,758,000
19,846,000
71,471,000
1,694,000
1,960,000
1,304,000
1,195,000
9,847,000
6,543,000
94,014,000
1,595,000
92,419,000
287,035,000
$
2019
7,750,000 $
4,830,000
56,846,000
24,220,000
93,646,000
12,497,000
6,644,000
2,496,000
2,172,000
1,195,000
595,000
119,245,000
1,822,000
117,423,000
404,458,000
2020
(4,216,000)
11,372,000
95,646,000
62,114,000
164,916,000
15,682,000
6,036,000
5,900,000
7,150,000
1,323,000
(13,563,000)
3,201,000
9,311,000
5,490,000
205,446,000
9,381,000
196,065,000
600,523,000View entire presentation