Modeling with New Disclosures Linking Price & Drivers to Financial Results
Sales Volumes Ranges
12.0
10.0
8.0
*
6.0
*
Potash Volumes
2014
2015
2016
2017
2018
2019
2020
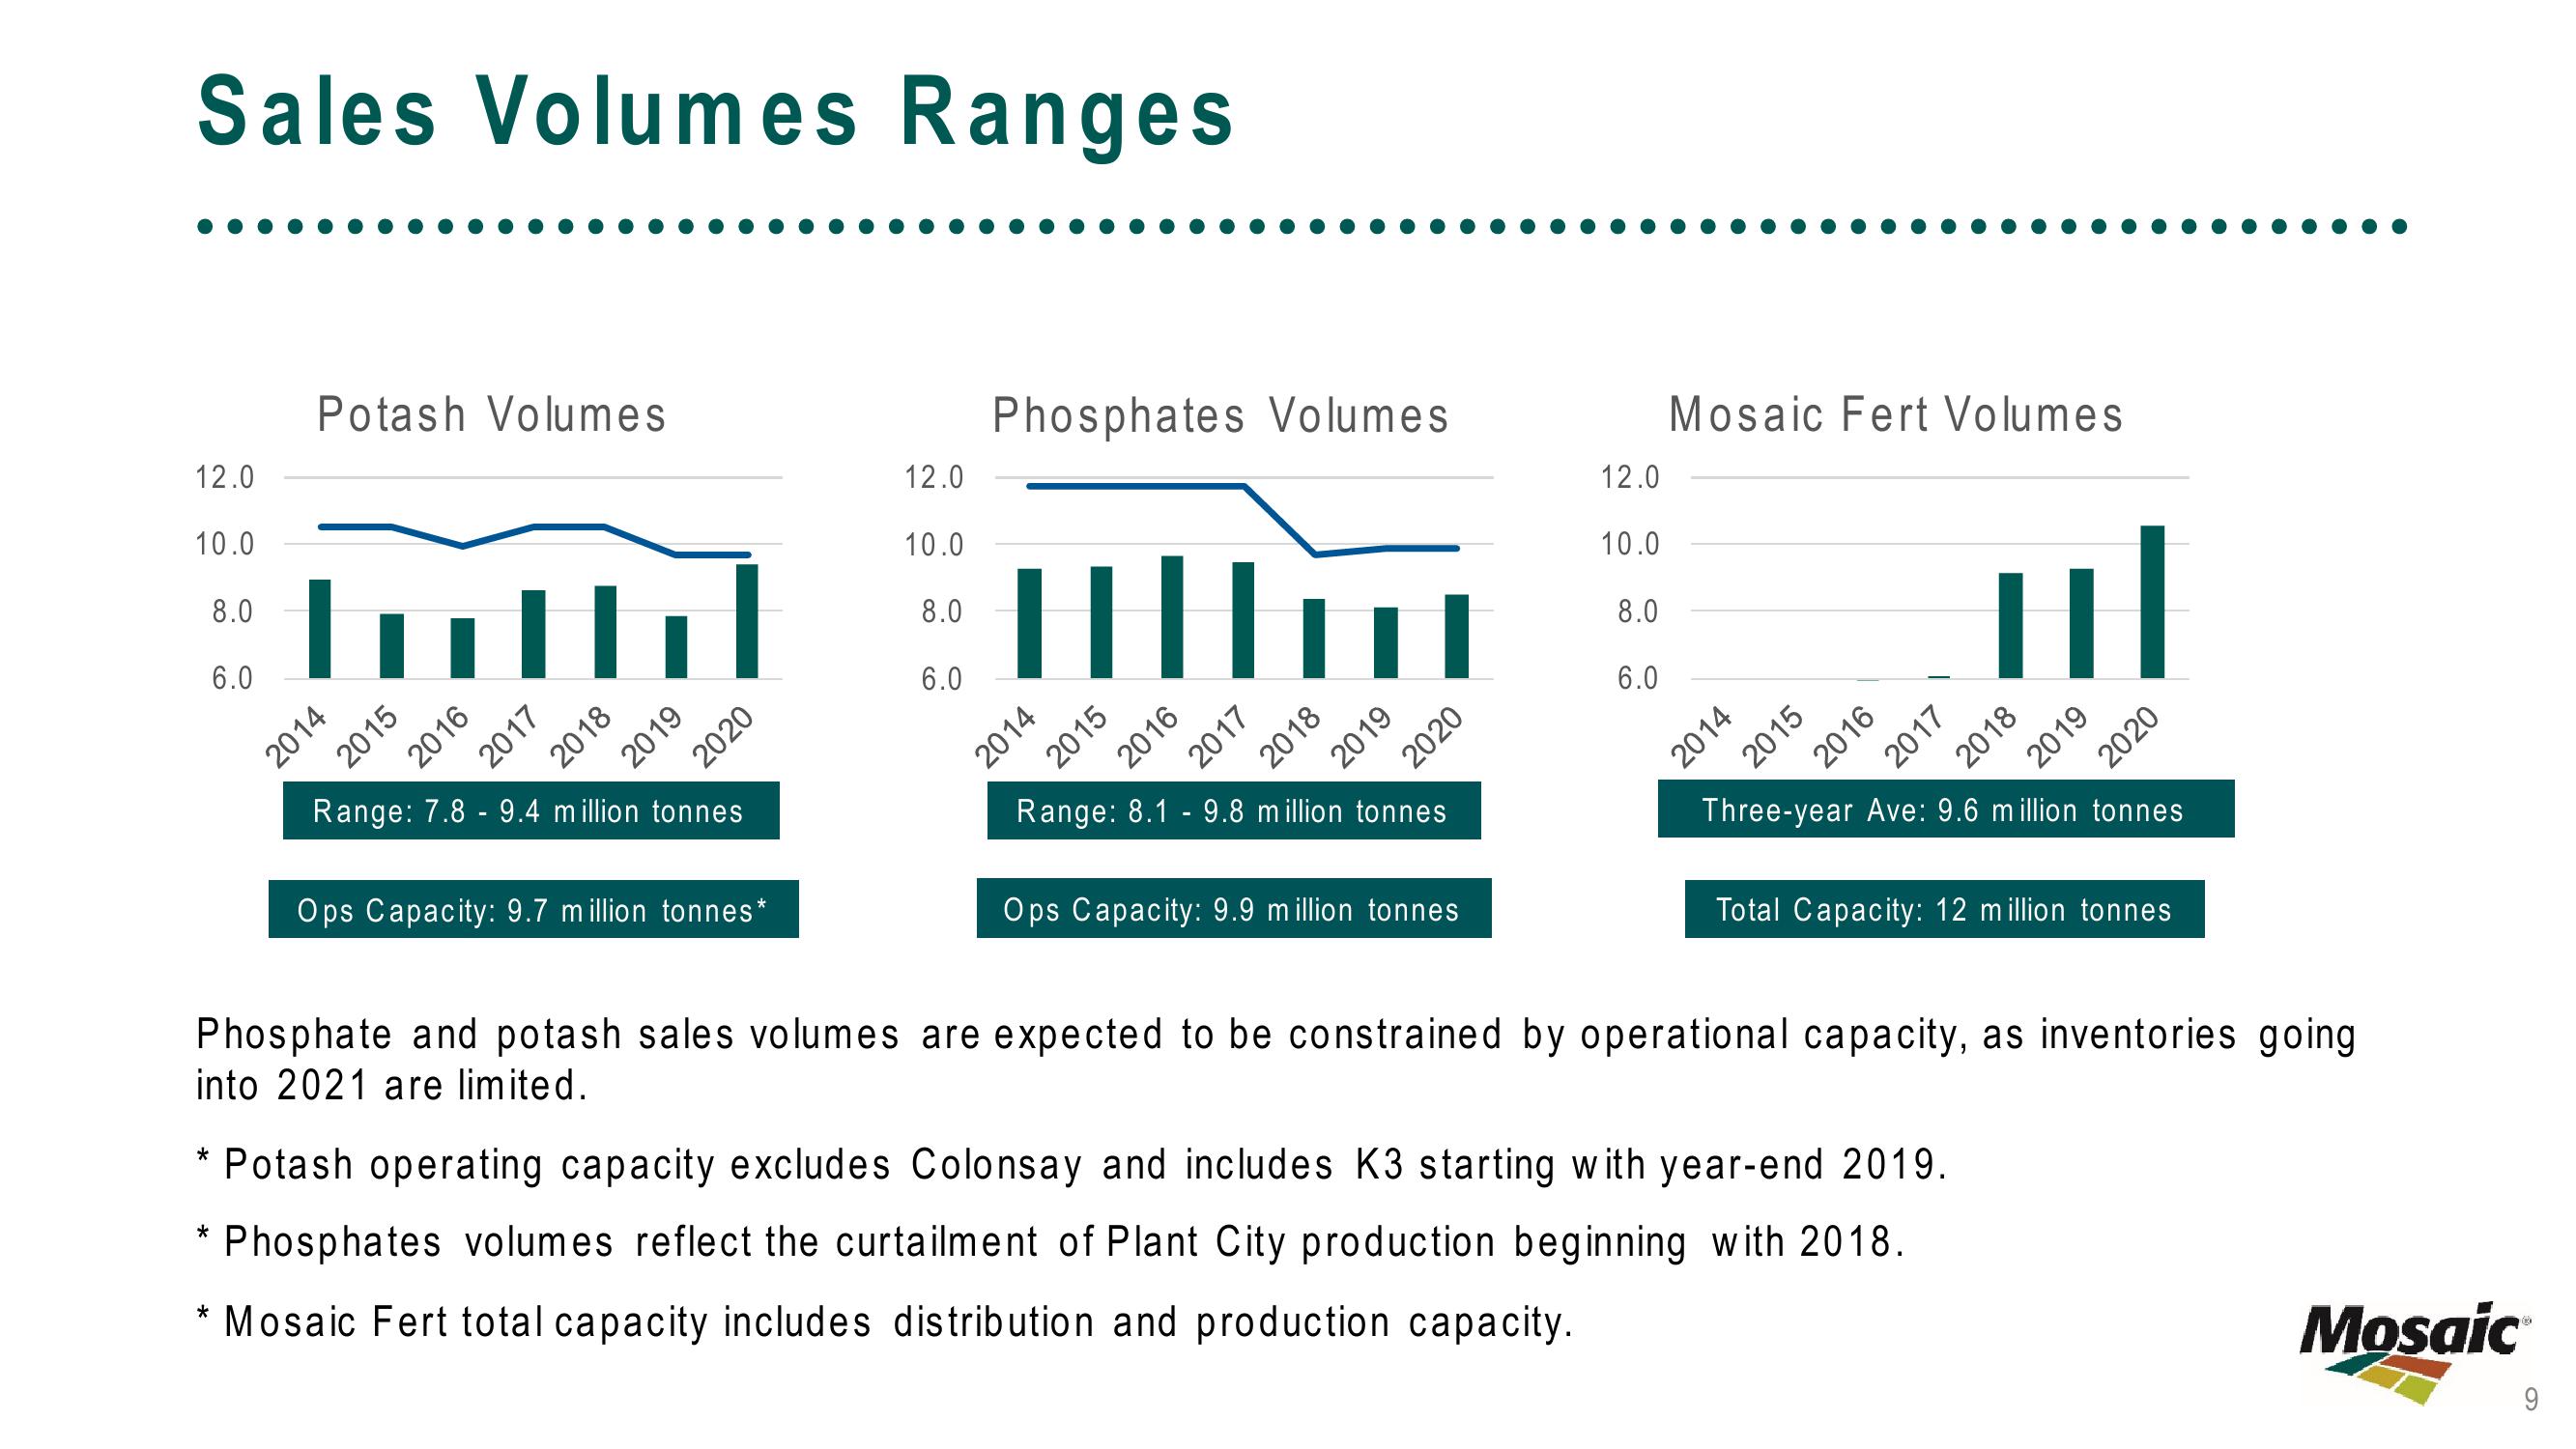
Range: 7.8 9.4 million tonnes
Ops Capacity: 9.7 million tonnes *
12.0
10.0
8.0
6.0
Phosphates Volumes
||||
2014
2015
2016
2017
2018
2019
2020
Range: 8.1 9.8 million tonnes
Ops Capacity: 9.9 million tonnes
12.0
10.0
8.0
6.0
Mosaic Fert Volumes
2014
2015
2016
2017
III
Potash operating capacity excludes Colonsay and includes K3 starting with year-end 2019.
Phosphates volumes reflect the curtailment of Plant City production beginning with 2018.
* Mosaic Fert total capacity includes distribution and production capacity.
2018
2019
2020
Three-year Ave: 9.6 million tonnes
Phosphate and potash sales volumes are expected to be constrained by operational capacity, as inventories going
into 2021 are limited.
Total Capacity: 12 million tonnes
Mosaic
9View entire presentation