J.P.Morgan Investment Banking Pitch Book
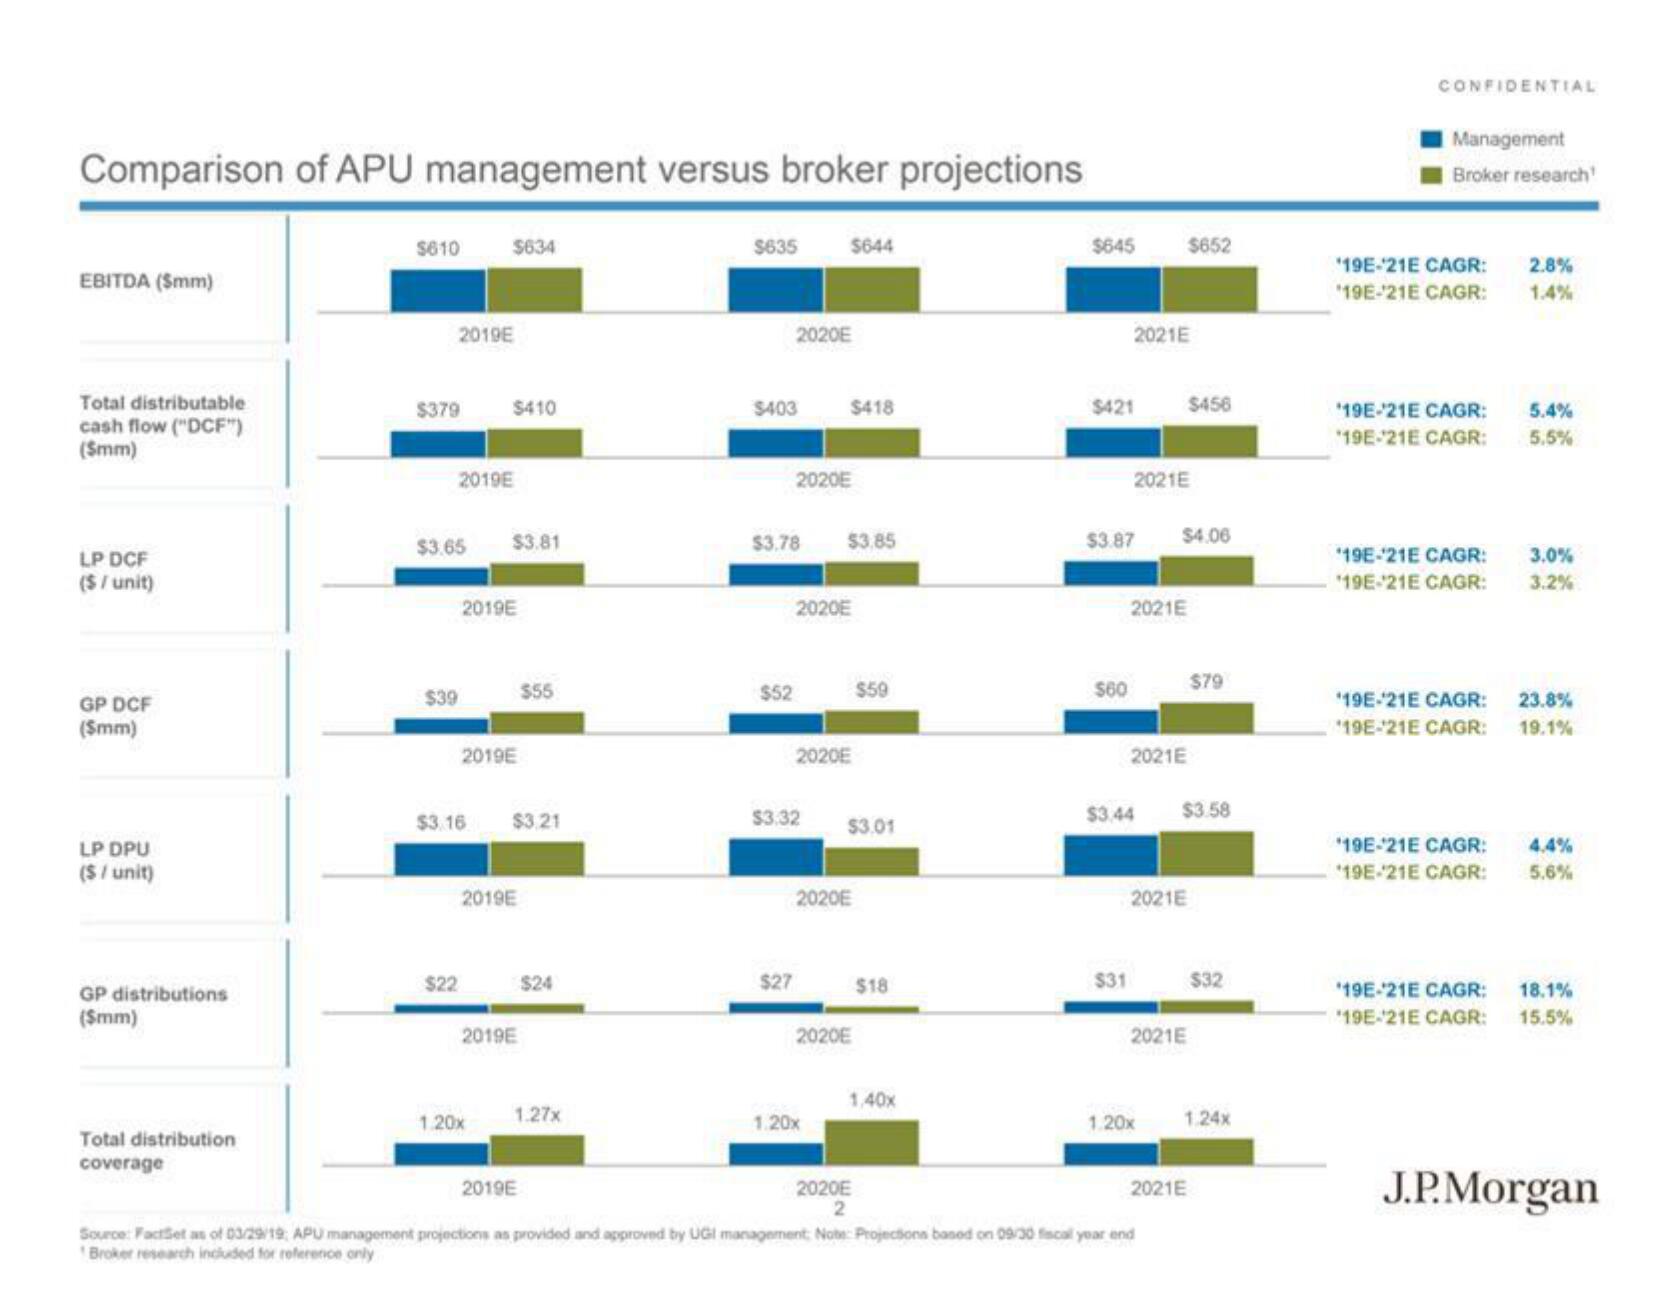
Comparison of APU management versus broker projections
EBITDA (5mm)
Total distributable
cash flow ("DCF")
(Smm)
LP DCF
($ / unit)
GP DCF
($mm)
LP DPU
($ / unit)
GP distributions
($mm)
Total distribution
coverage
$610
2019E
$379
2019E
$39
$634
$3.65 $3.81
$22
$410
$3.16
2019E
2019E
1.20x
2019E
$3.21
2019E
$55
2019E
$24
1.27x
$635
2020E
$403 $418
$3.78
2020E
$52
$27
$644
$3.32
2020E
$3,85
2020E
1.20x
2020E
$3.01
2020E
$59
2020E
2
$18
1,40x
$645
$421 $456
$60
2021E
$3.87
$31
2021E
2021E
$3.44
2021E
$4.06
$652
2021E
1.20x
2021E
Source: FactSet as of 03/29/19; APU management projections as provided and approved by UGI management Note: Projections based on 09/30 fiscal year end
Broker research included for reference only
$3.58
2021E
$79
$32
1248
CONFIDENTIAL
Management
Broker research
'19E-21E CAGR:
*19E-¹21E CAGR:
19E-21E CAGR:
19E-21E CAGR:
19E-21E CAGR:
19E-21E CAGR:
'19E-21E CAGR:
19E-21E CAGR:
19E-21E CAGR:
19E-21E CAGR:
'19E-21E CAGR:
19E-21E CAGR:
2.8%
1.4%
5.4%
5.5%
3.0%
3.2%
23.8%
19.1%
4.4%
5.6%
18.1%
15.5%
J.P.MorganView entire presentation