CubeSmart Investor Presentation Deck
Dominant Market Position
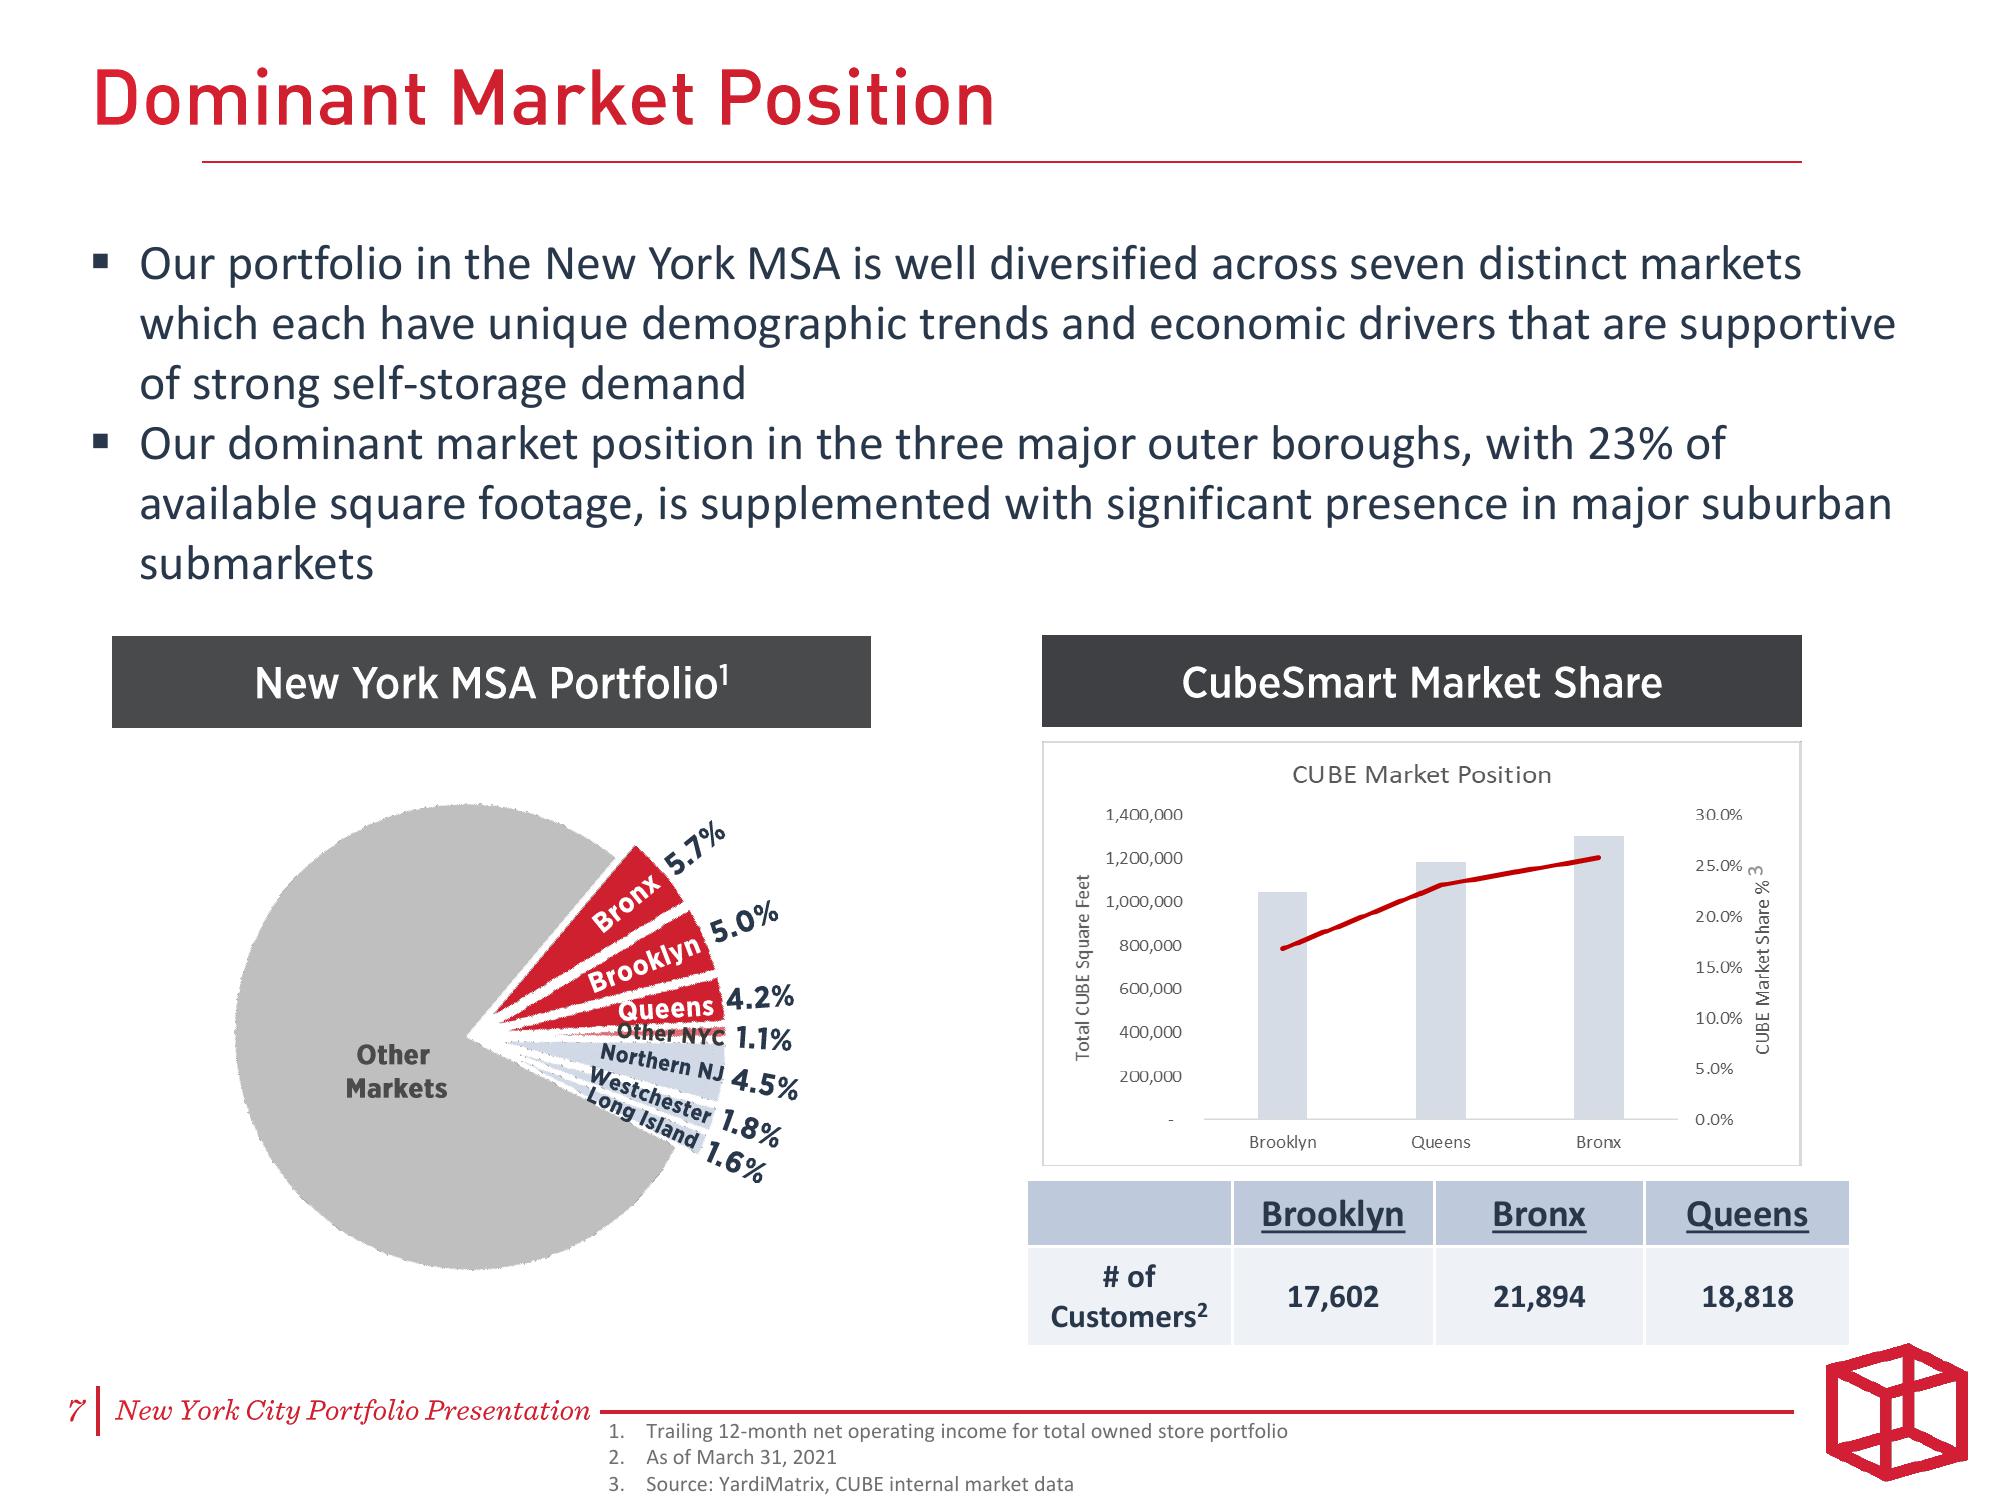
▪ Our portfolio in the New York MSA is well diversified across seven distinct markets
which each have unique demographic trends and economic drivers that are supportive
of strong self-storage demand
▪ Our dominant market position in the three major outer boroughs, with 23% of
available square footage, is supplemented with significant presence in major suburban
submarkets
7|
New York MSA Portfolio¹
Other
Markets
Bronx 5.7%
Brooklyn 5.0%
Queens 4.2%
Other NYC 1.1%
Northern NJ 4.5%
Westchester 1.8%
Long Island 1.6%
New York City Portfolio Presentation
Total CUBE Square Feet
1,400,000
1,200,000
1,000,000
CubeSmart Market Share
800,000
600,000
400,000
200,000
# of
Customers²
CUBE Market Position
m
Brooklyn
Brooklyn
1. Trailing 12-month net operating income for total owned store portfolio
As of March 31, 2021
2.
3. Source: YardiMatrix, CUBE internal market data
17,602
Queens
Bronx
Bronx
21,894
30.0%
25.0% m
20.0%
15.0%
10.0%
5.0%
0.0%
CUBE Market Share % 3
Queens
18,818View entire presentation