Alcon Q1 2023 Earnings Presentation
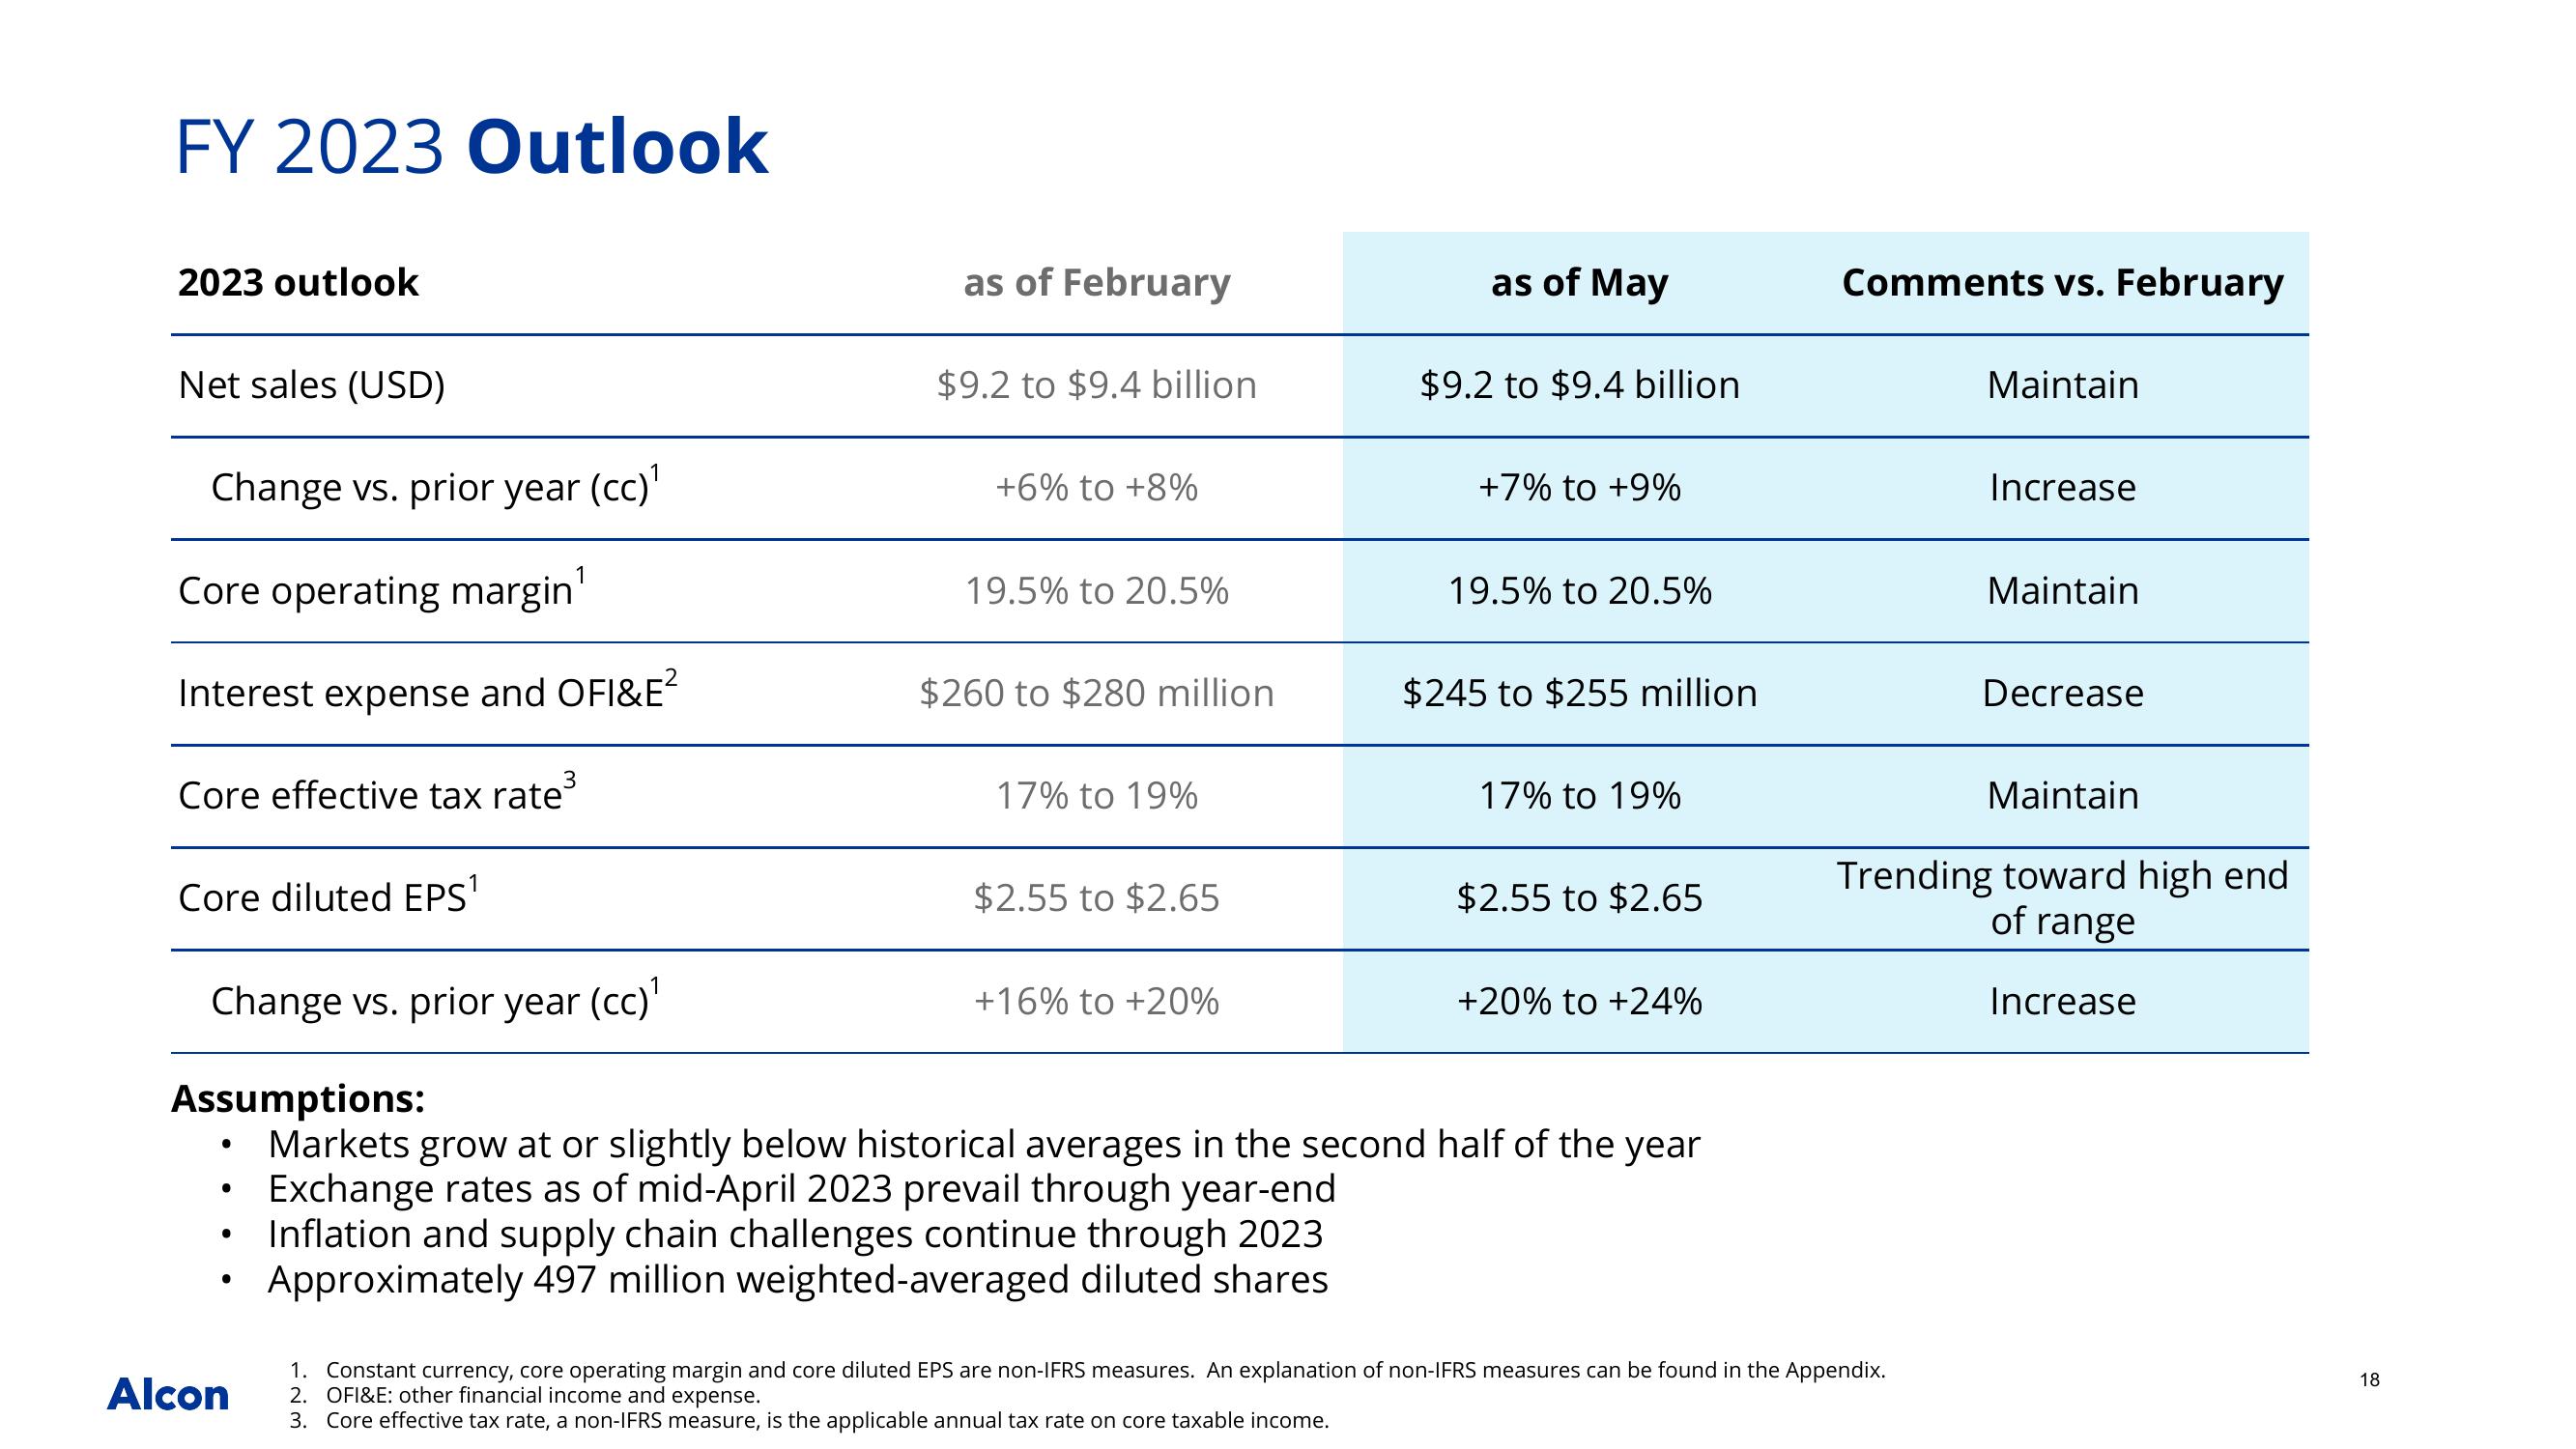
FY 2023 Outlook
2023 outlook
●
Net sales (USD)
Change vs. prior year (cc)¹
Core operating margin'
Interest expense and OFI&E²
3
Core effective tax rate³
Core diluted EPS¹
Change vs. prior year (cc)¹
Assumptions:
Markets grow at or slightly below historical averages in the second half of the year
Exchange rates as of mid-April 2023 prevail through year-end
Inflation and supply chain challenges continue through 2023
Approximately 497 million weighted-averaged diluted shares
●
●
●
Alcon
as of February
1
$9.2 to $9.4 billion
+6% to +8%
19.5% to 20.5%
$260 to $280 million
17% to 19%
$2.55 to $2.65
as of May
+16% to +20%
$9.2 to $9.4 billion
+7% to +9%
19.5% to 20.5%
$245 to $255 million
17% to 19%
$2.55 to $2.65
+20% to +24%
Comments vs. February
Maintain
1. Constant currency, core operating margin and core diluted EPS are non-IFRS measures. An explanation of non-IFRS measures can be found in the Appendix.
2. OFI&E: other financial income and expense.
3. Core effective tax rate, a non-IFRS measure, is the applicable annual tax rate on core taxable income.
Increase
Maintain
Decrease
Maintain
Trending toward high end
of range
Increase
18View entire presentation