Asos Results Presentation Deck
© 2022 asoS
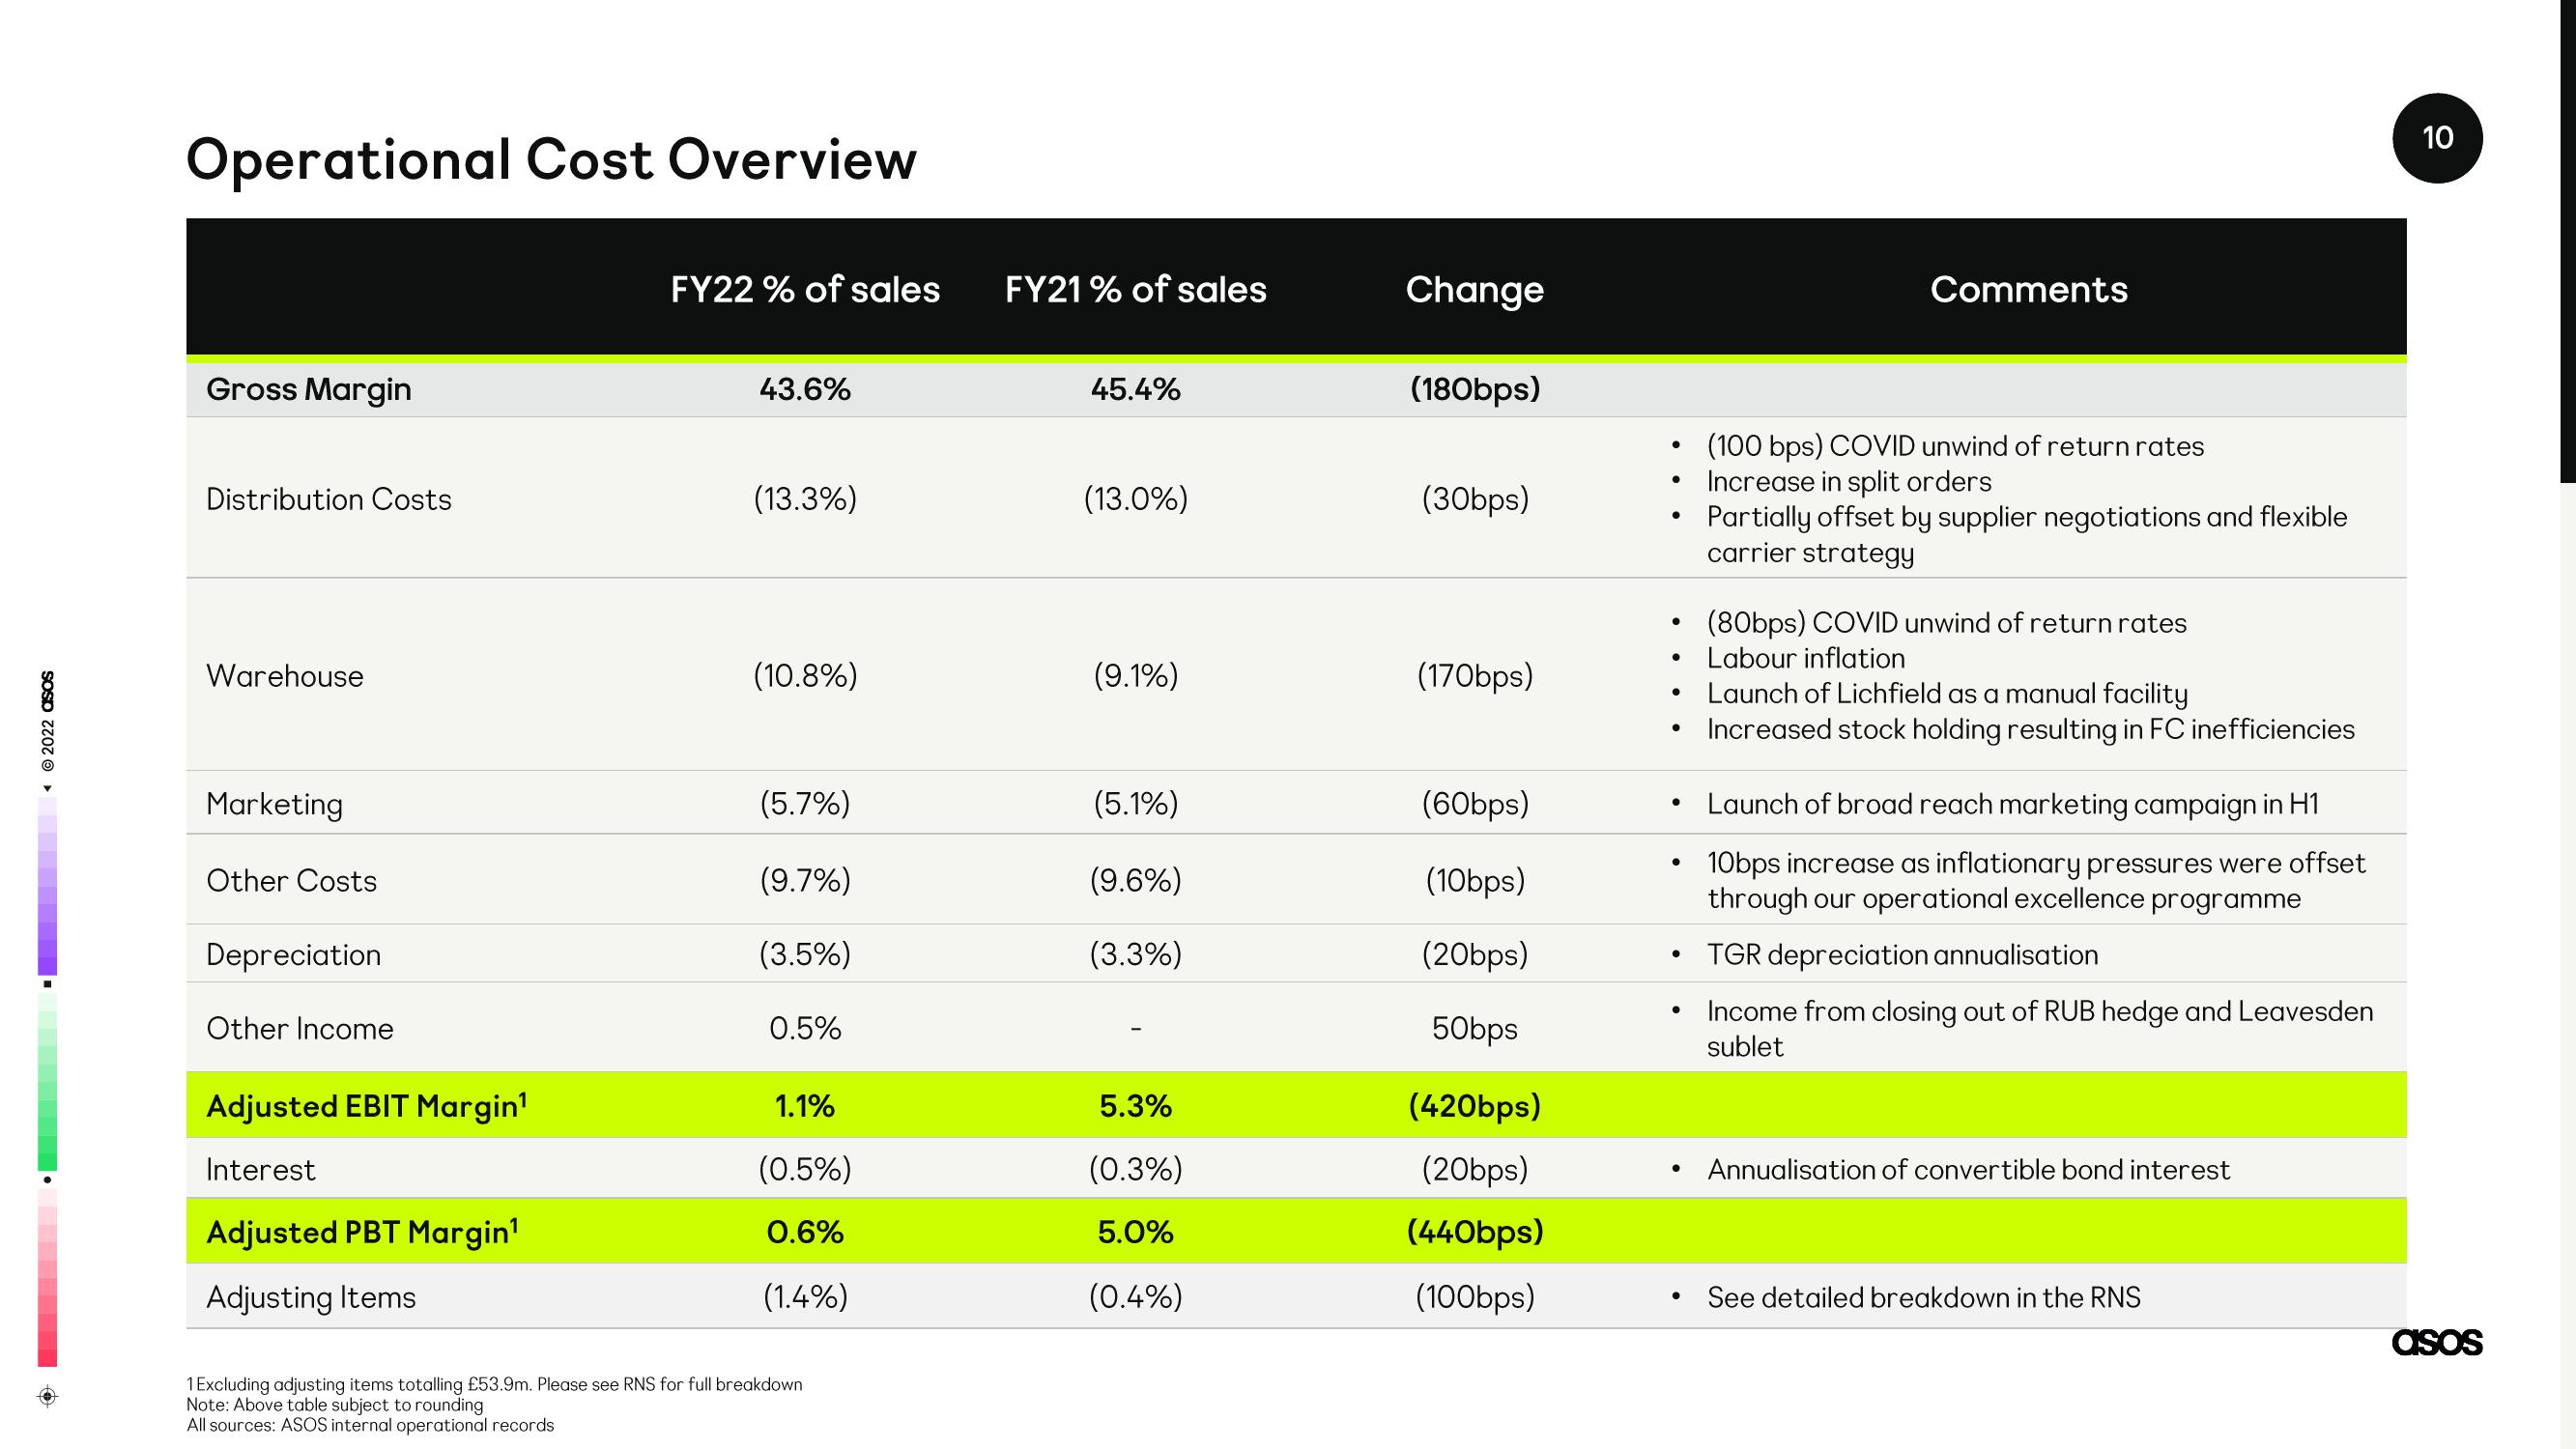
Operational Cost Overview
Gross Margin
Distribution Costs
Warehouse
Marketing
Other Costs
Depreciation
Other Income
Adjusted EBIT Margin¹
Interest
Adjusted PBT Margin¹
Adjusting Items
FY22 % of sales
43.6%
(13.3%)
(10.8%)
(5.7%)
(9.7%)
(3.5%)
0.5%
1.1%
(0.5%)
0.6%
(1.4%)
1 Excluding adjusting items totalling £53.9m. Please see RNS for full breakdown
Note: Above table subject to rounding
All sources: ASOS internal operational records
FY21% of sales
45.4%
(13.0%)
(9.1%)
(5.1%)
(9.6%)
(3.3%)
5.3%
(0.3%)
5.0%
(0.4%)
Change
(180bps)
(30bps)
(170bps)
(60bps)
(10bps)
(20bps)
50bps
(420bps)
(20bps)
(440bps)
(100bps)
●
●
●
●
●
●
●
Comments
(100 bps) COVID unwind of return rate
Increase in split orders
Partially offset by supplier negotiations and flexible
carrier strategy
(80bps) COVID unwind of return rates
Labour inflation
Launch of Lichfield as a manual facility
Increased stock holding resulting in FC inefficiencies
Launch of broad reach marketing campaign in H1
10bps increase as inflationary pressures were offset
through our operational excellence programme
TGR depreciation annualisation
Income from closing out of RUB hedge and Leavesden
sublet
Annualisation of convertible bond interest
See detailed breakdown in the RNS
10
asosView entire presentation