Nexters Results Presentation Deck
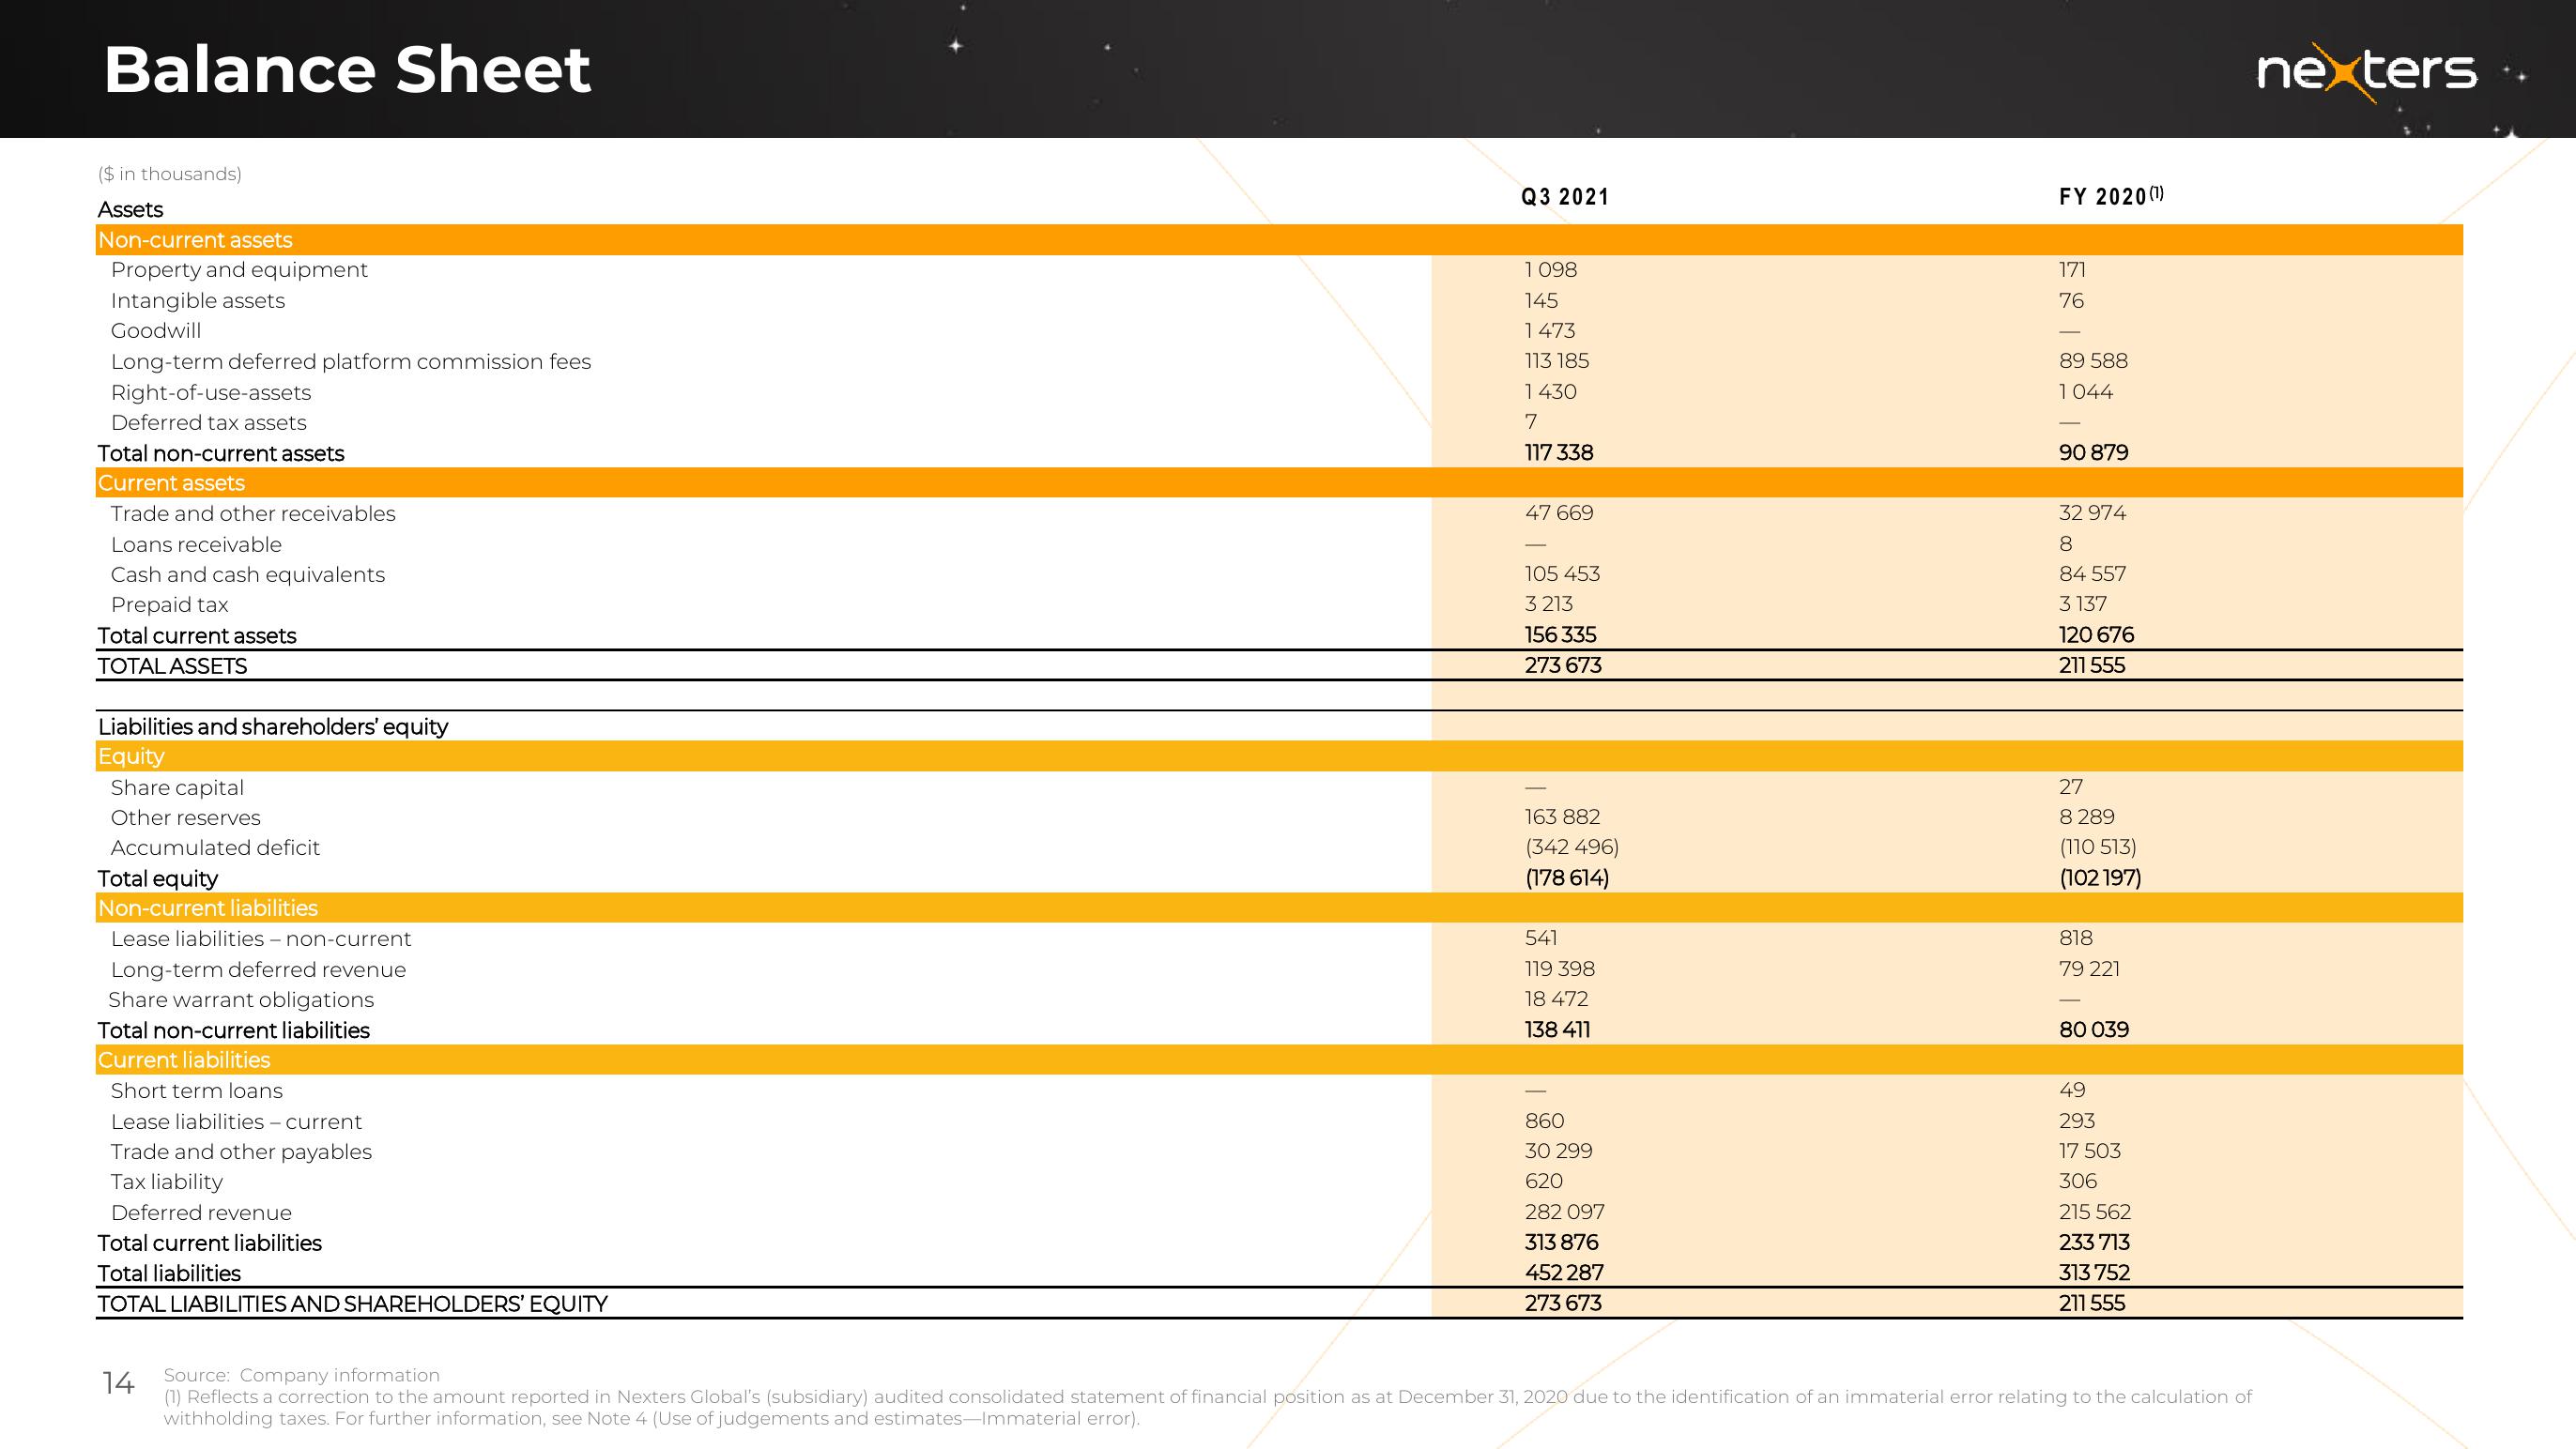
Balance Sheet
($ in thousands)
Assets
Non-current assets
Property and equipment
Intangible assets
Goodwill
Long-term deferred platform commission fees
Right-of-use-assets
Deferred tax assets
Total non-current assets
Current assets
Trade and other receivables
Loans receivable
Cash and cash equivalents
Prepaid tax
Total current assets
TOTAL ASSETS
Liabilities and shareholders' equity
Equity
Share capital
Other reserves
Accumulated deficit
Total equity
Non-current liabilities
Lease liabilities - non-current
Long-term deferred revenue
Share warrant obligations
Total non-current liabilities
Current liabilities
Short term loans
Lease liabilities - current
Trade and other payables
Tax liability
Deferred revenue
Total current liabilities
Total liabilities
TOTAL LIABILITIES AND SHAREHOLDERS' EQUITY
Q3 2021
1 098
145
1473
113 185
1430
7
117 338
47 669
105 453
3 213
156 335
273 673
163 882
(342 496)
(178 614)
541
119 398
18 472
138 411
860
30 299
620
282 097
313 876
452 287
273 673
FY 2020 (¹)
171
76
89 588
1044
90 879
32 974
8
84 557
3 137
120 676
211 555
27
8 289
(110 513)
(102197)
818
79 221
80 039
49
293
17 503
306
215 562
233 713
313 752
211 555
14
Source: Company information
(1) Reflects a correction to the amount reported in Nexters Global's (subsidiary) audited consolidated statement of financial position as at December 31, 2020 due to the identification of an immaterial error relating to the calculation of
withholding taxes. For further information, see Note 4 (Use of judgements and estimates-Immaterial error).
nexters.View entire presentation