Uber Results Presentation Deck
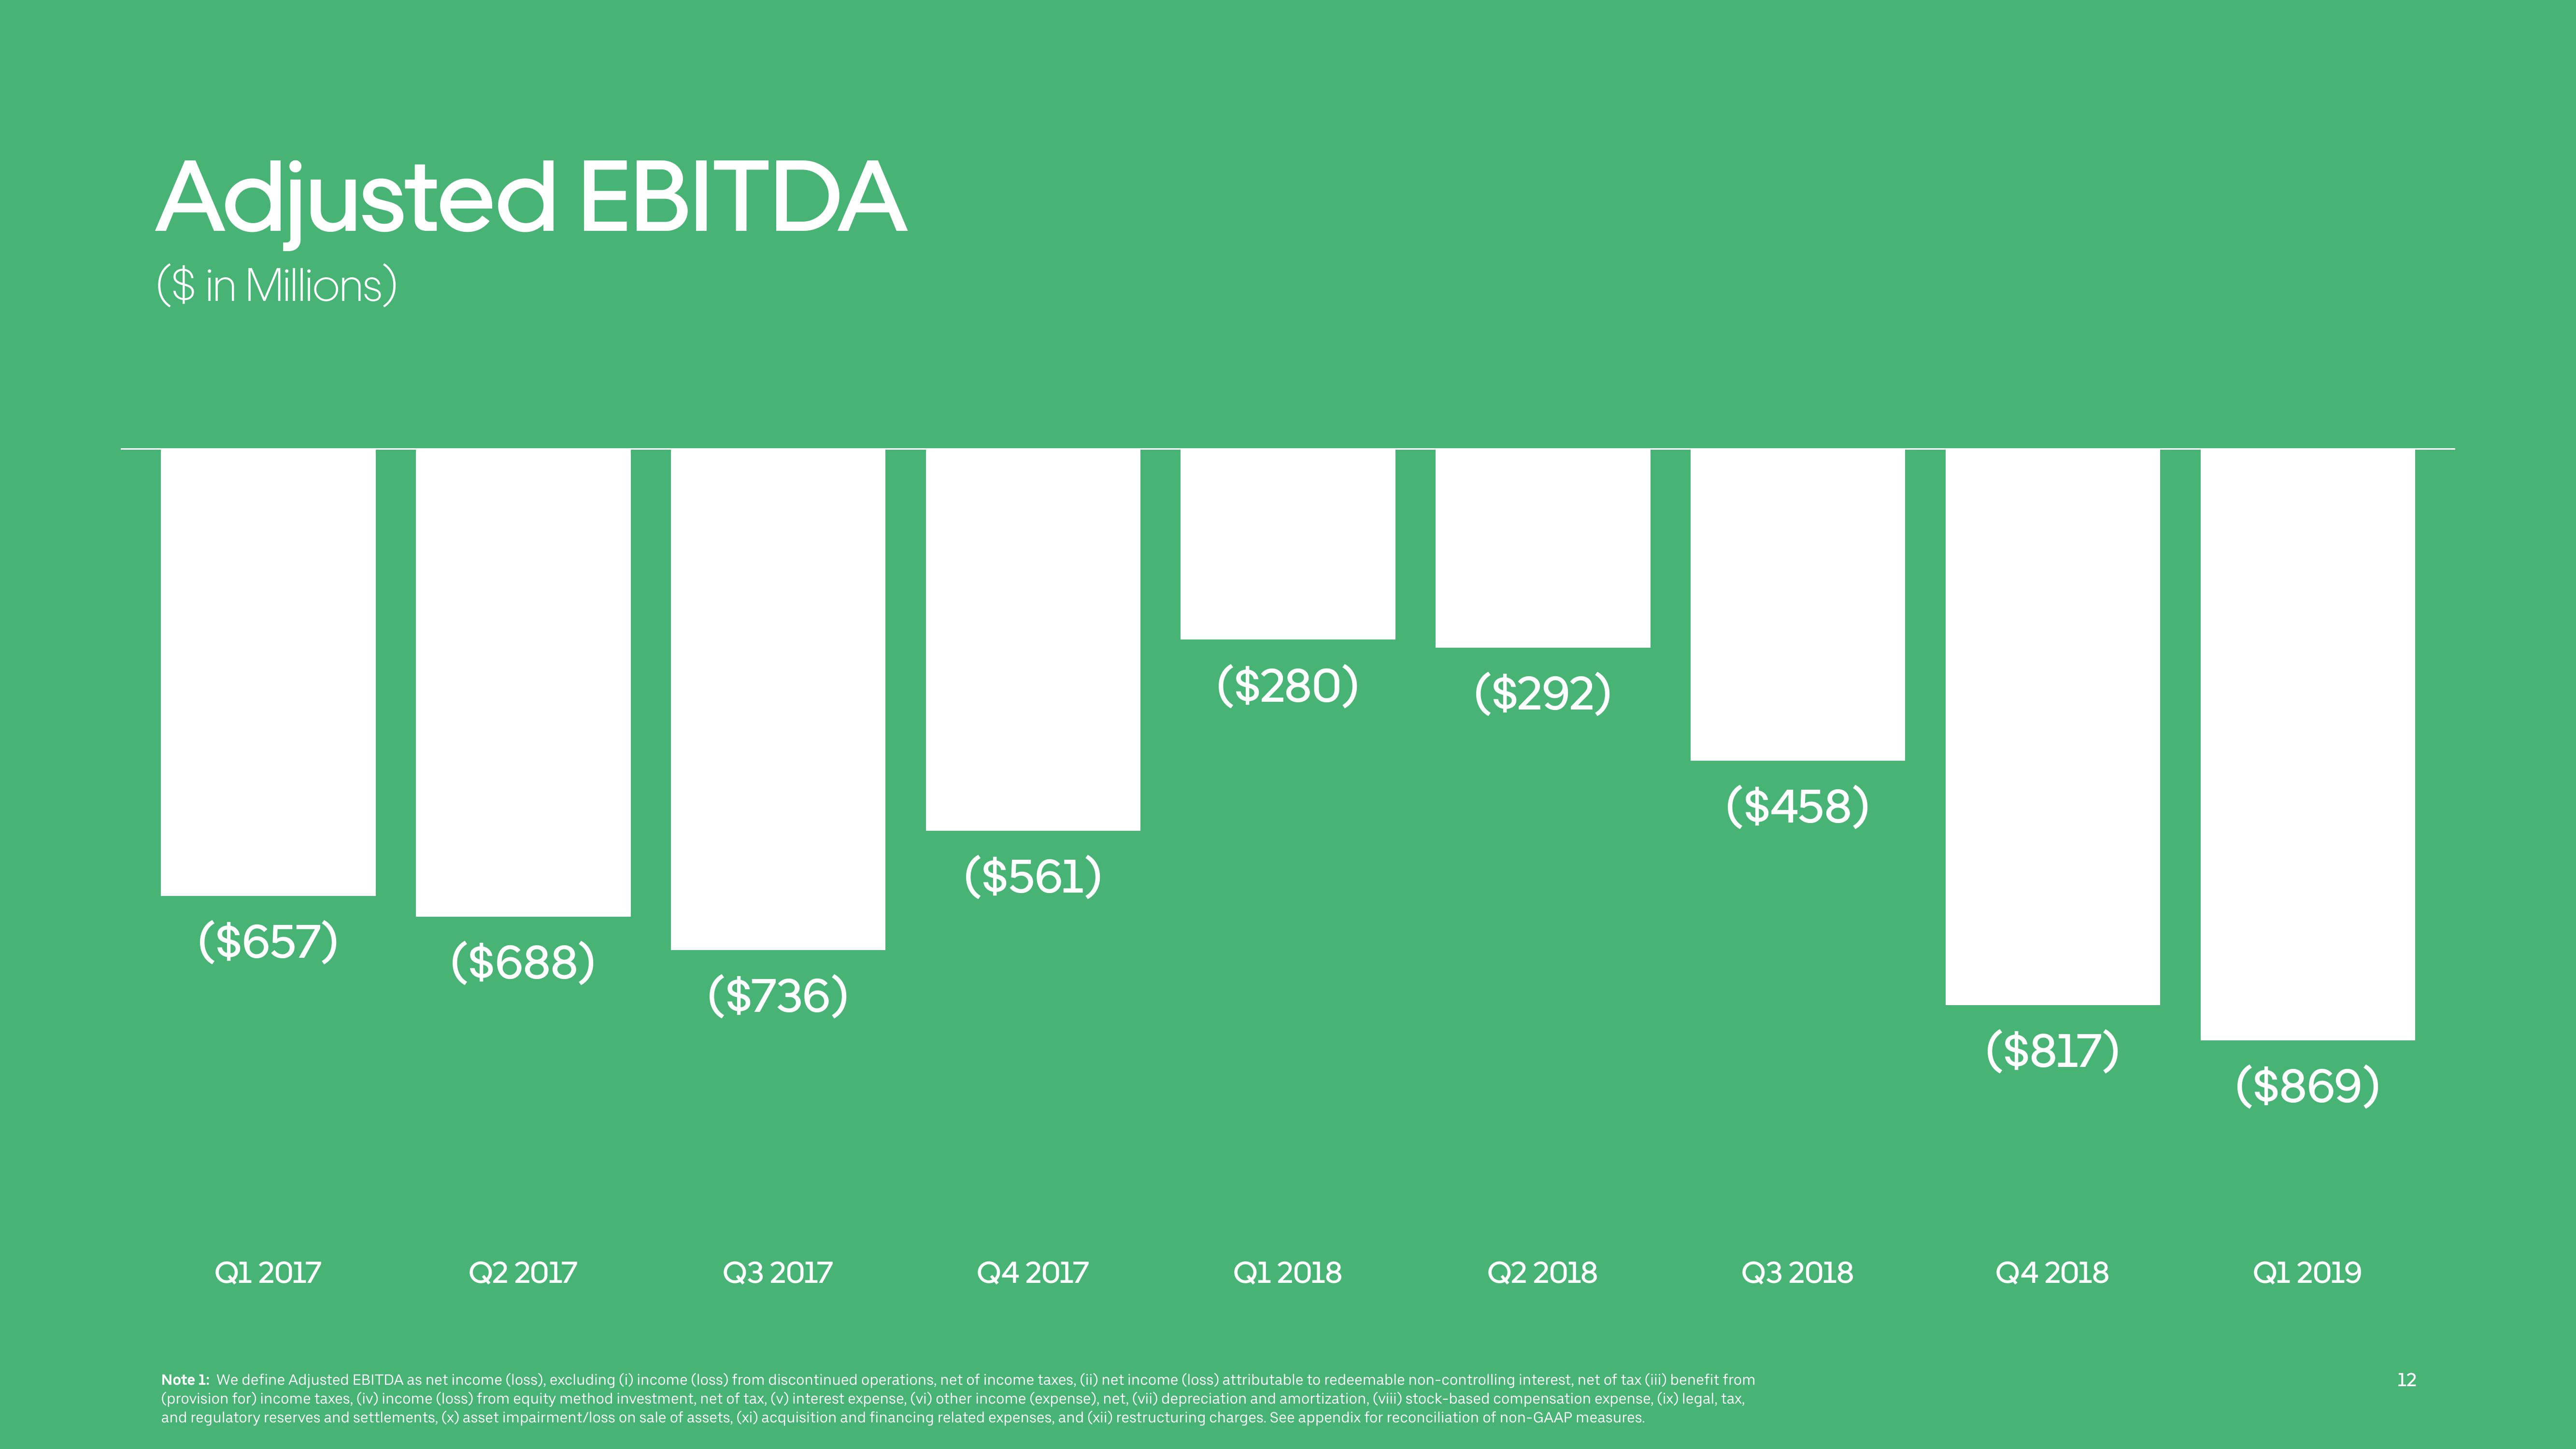
Adjusted EBITDA
($ in Millions)
($657)
Q1 2017
($688)
Q2 2017
($736)
Q3 2017
($561)
Q4 2017
($280)
Q1 2018
($292)
Q2 2018
($458)
Q3 2018
Note 1: We define Adjusted EBITDA as net income (loss), excluding (i) income (loss) from discontinued operations, net of income taxes, (ii) net income (loss) attributable to redeemable non-controlling interest, net of tax (iii) benefit from
(provision for) income taxes, (iv) income (loss) from equity method investment, net of tax, (v) interest expense, (vi) other income (expense), net, (vii) depreciation and amortization, (viii) stock-based compensation expense, (ix) legal, tax,
and regulatory reserves and settlements, (x) asset impairment/loss on sale of assets, (xi) acquisition and financing related expenses, and (xii) restructuring charges. See appendix for reconciliation of non-GAAP measures.
($817)
Q4 2018
($869)
Q1 2019
12View entire presentation