Corporate Presentation
Financial Summary
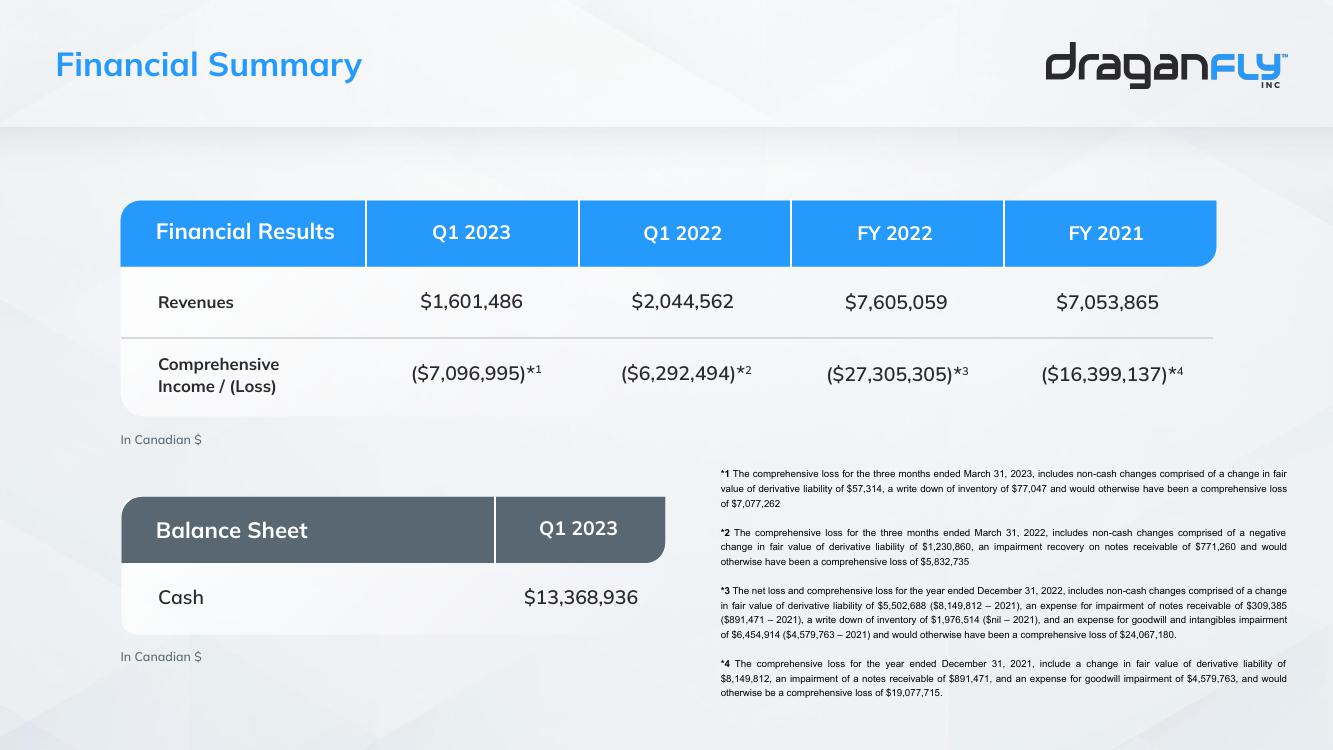
Financial Results
Revenues
Comprehensive
Income (Loss)
In Canadian $
Balance Sheet
Cash
In Canadian $
Q1 2023
$1,601,486
($7,096,995)*¹
Q1 2023
Q1 2022
$2,044,562
($6,292,494)*2
$13,368,936
FY 2022
$7,605,059
($27,305,305)*3
draganfly
FY 2021
$7,053,865
($16,399,137)*4
*1 The comprehensive loss for the three months ended March 31, 2023, includes non-cash changes comprised of a change in fair
value of derivative liability of $57,314, a write down of inventory of $77,047 and would otherwise have been a comprehensive loss
of $7,077,262
*2 The comprehensive loss for the three months ended March 31, 2022, includes non-cash changes comprised of a negative
change in fair value of derivative liability of $1,230,860, an impairment recovery on notes receivable of $771,260 and would
otherwise have been a comprehensive loss of $5,832,735
The net loss and comprehensive loss for the year ended December 31, 2022, includes non-cash changes comprised of a change
in fair value of derivative liability of $5,502,688 ($8,149,812 - 2021), an expense for impairment of notes receivable of $309,385
($891,471 - 2021), a write down of inventory of $1,976,514 ($nil - 2021), and an expense for goodwill and intangibles impairment
of $6,454,914 ($4,579,763-2021) and would otherwise have been a comprehensive loss of $24,067,180.
*4 The comprehensive loss for the year ended December 31, 2021, include a change in fair value of derivative liability of
$8,149,812, impairment of a notes receivable of $891,471, and an expense for goodwill impairment of $4,579,763, and would
otherwise be a comprehensive loss of $19,077,715.View entire presentation