Bill.com Investor Presentation Deck
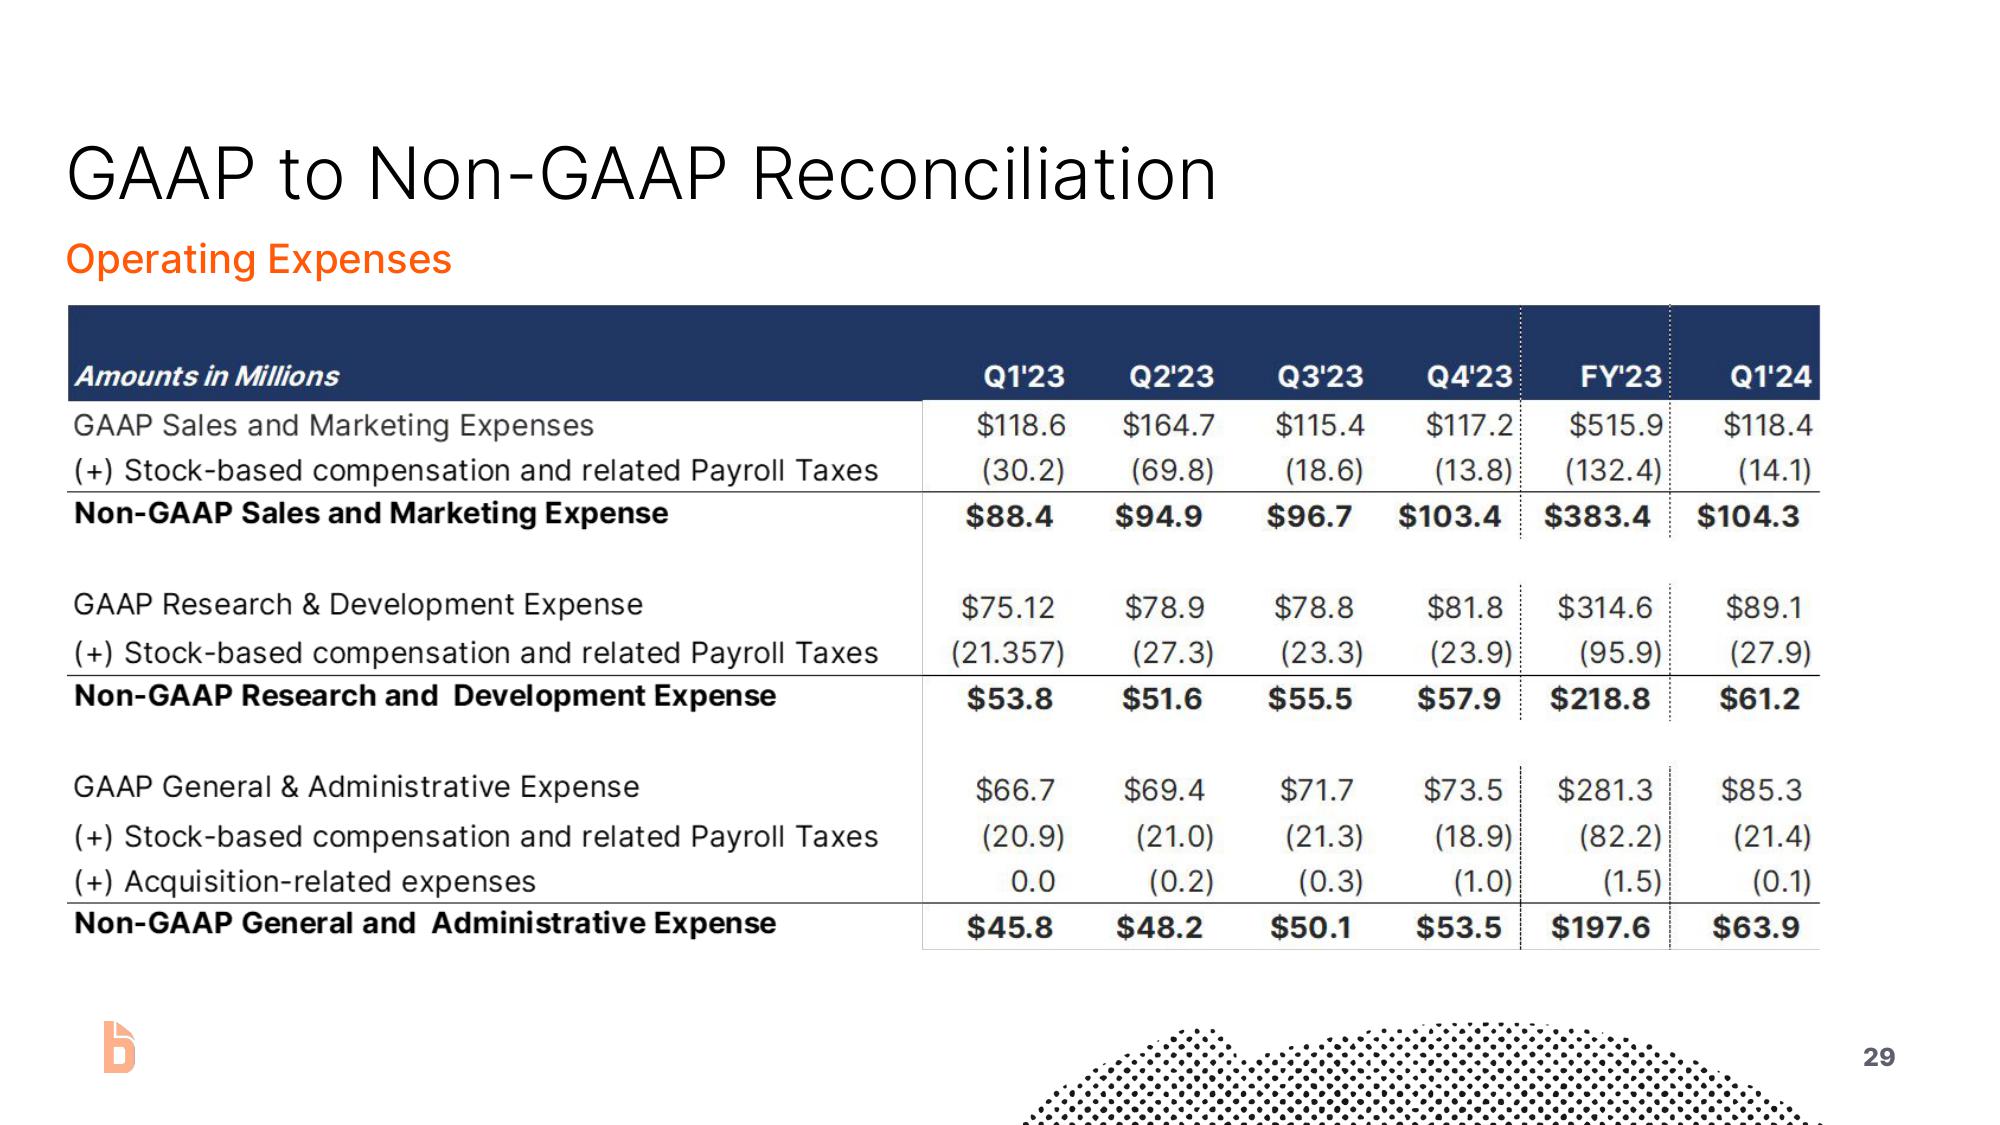
GAAP to Non-GAAP Reconciliation
Operating Expenses
Amounts in Millions
GAAP Sales and Marketing Expenses
(+) Stock-based compensation and related Payroll Taxes
Non-GAAP Sales and Marketing Expense
GAAP Research & Development Expense
(+) Stock-based compensation and related Payroll Taxes
Non-GAAP Research and Development Expense
GAAP General & Administrative Expense
(+) Stock-based compensation and related Payroll Taxes
(+) Acquisition-related expenses
Non-GAAP General and Administrative Expense
Q1'23 Q2'23 Q3'23 Q4'23 FY¹23 Q1'24
$118.6 $164.7 $115.4 $117.2 $515.9 $118.4
(30.2) (69.8) (18.6) (13.8) (132.4) (14.1)
$88.4 $94.9 $96.7 $103.4 $383.4 $104.3
$75.12 $78.9 $78.8 $81.8 $314.6
(21.357) (27.3) (23.3) (23.9)
$53.8 $51.6 $55.5 $57.9
(95.9)
$66.7
(20.9)
0.0
$45.8
$69.4
$71.7
(21.0) (21.3)
(0.2)
$48.2
$218.8
$73.5 $281.3
(18.9)
(1.0)
(0.3)
$50.1 $53.5 $197.6
(82.2)
(1.5)
$89.1
(27.9)
$61.2
$85.3
(21.4)
(0.1)
$63.9
29View entire presentation