Inovalon Results Presentation Deck
Reconciliation of Forward-Looking Guidance Adjusted
EBITDA
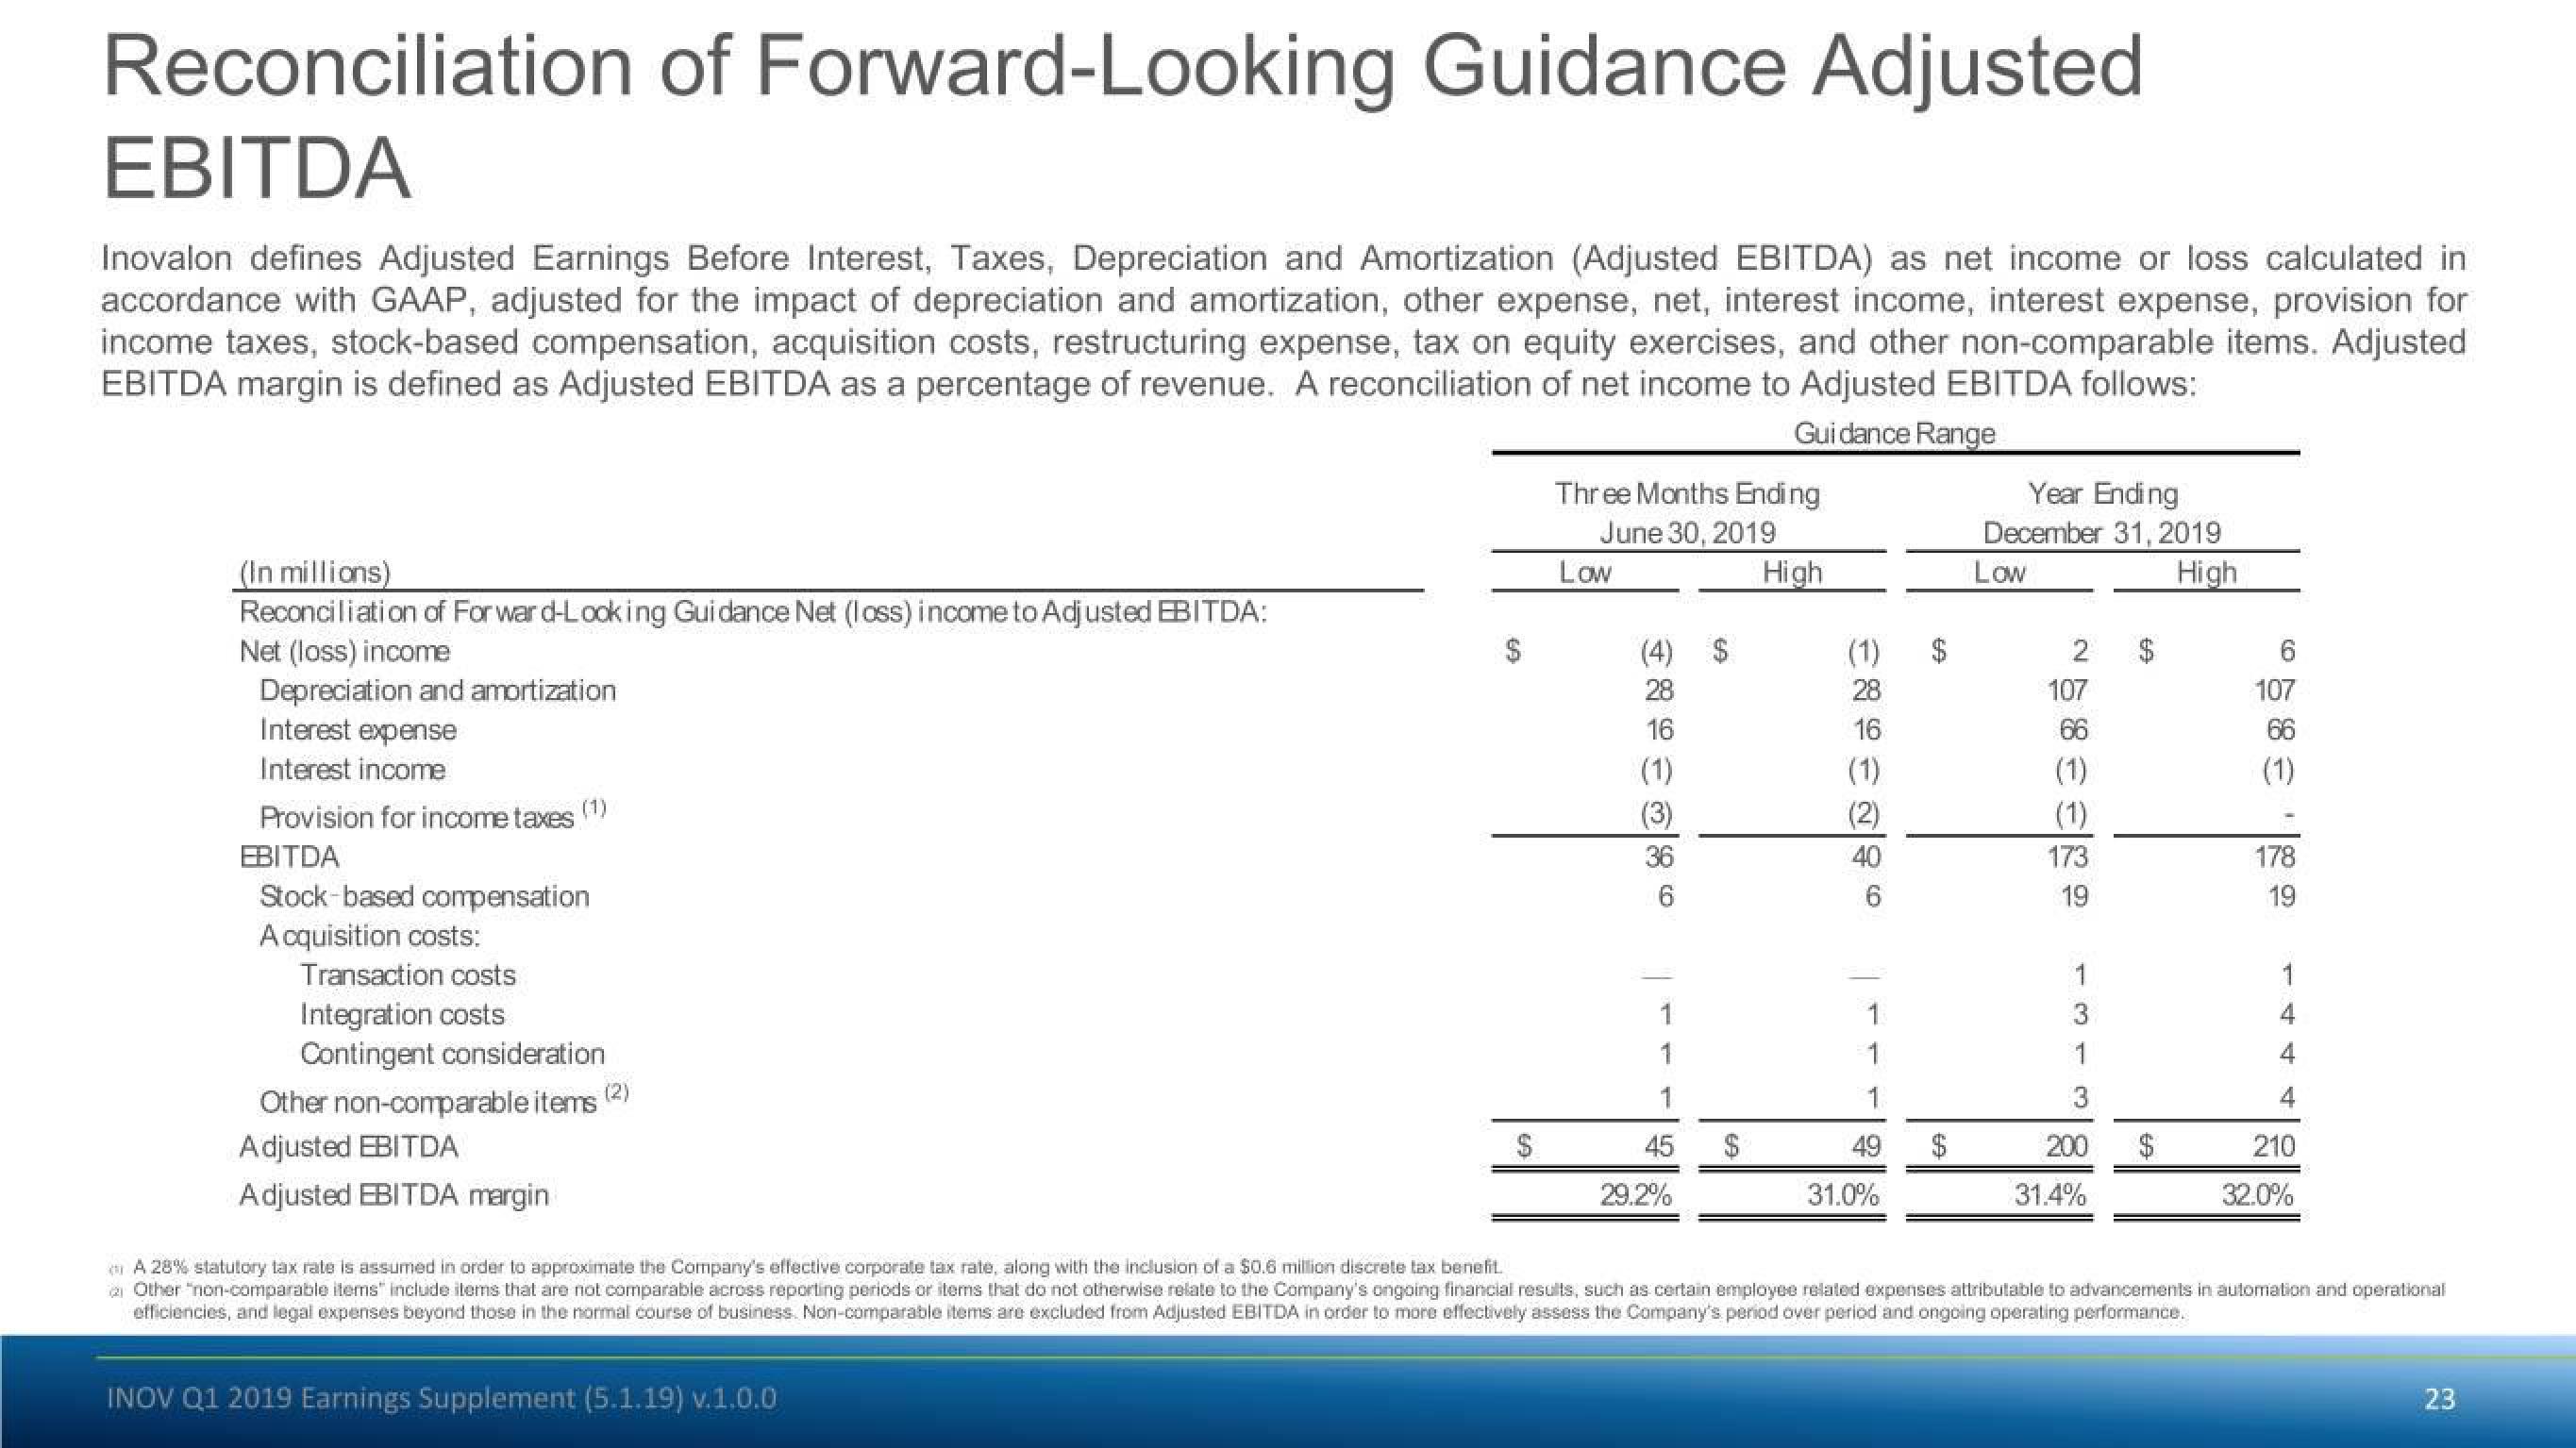
Inovalon defines Adjusted Earnings Before Interest, Taxes, Depreciation and Amortization (Adjusted EBITDA) as net income or loss calculated in
accordance with GAAP, adjusted for the impact of depreciation and amortization, other expense, net, interest income, interest expense, provision for
income taxes, stock-based compensation, acquisition costs, restructuring expense, tax on equity exercises, and other non-comparable items. Adjusted
EBITDA margin is defined as Adjusted EBITDA as a percentage of revenue. A reconciliation of net income to Adjusted EBITDA follows:
Guidance Range
(In millions)
Reconciliation of Forward-Looking Guidance Net (loss) income to Adjusted EBITDA:
Net (loss) income
Depreciation and amortization
Interest expense
Interest income
Provision for income taxes (¹)
EBITDA
Stock-based compensation
Acquisition costs:
Transaction costs
Integration costs
Contingent consideration
Other non-comparable items
Adjusted EBITDA
Adjusted EBITDA margin
69
INOV Q1 2019 Earnings Supplement (5.1.19) v.1.0.0
Three Months Ending
June 30, 2019
Low
(4)
28
16
(1)
(3)
36
1
1
1
45
29.2%
High
(1)
28
16
(1)
(2)
40
1
1
1
49
31.0%
Year Ending
December 31, 2019
Low
High
2
107
66
(1)
(1)
173
19
1
3
1
3
200
31.4%
6
107
66
(1)
178
19
1
4
4
4
210
32.0%
A 28% statutory tax rate is assumed in order to approximate the Company's effective corporate tax rate, along with the inclusion of a $0.6 million discrete tax benefit.
2 Other "non-comparable items include items that are not comparable across reporting periods or items that do not otherwise relate to the Company's ongoing financial results, such as certain employee related expenses attributable to advancements in automation and operational
efficiencies, and legal expenses beyond those in the normal course of business. Non-comparable items are excluded from Adjusted EBITDA in order to more effectively assess the Company's period over period and ongoing operating performance.
23View entire presentation