Topps SPAC Presentation Deck
28
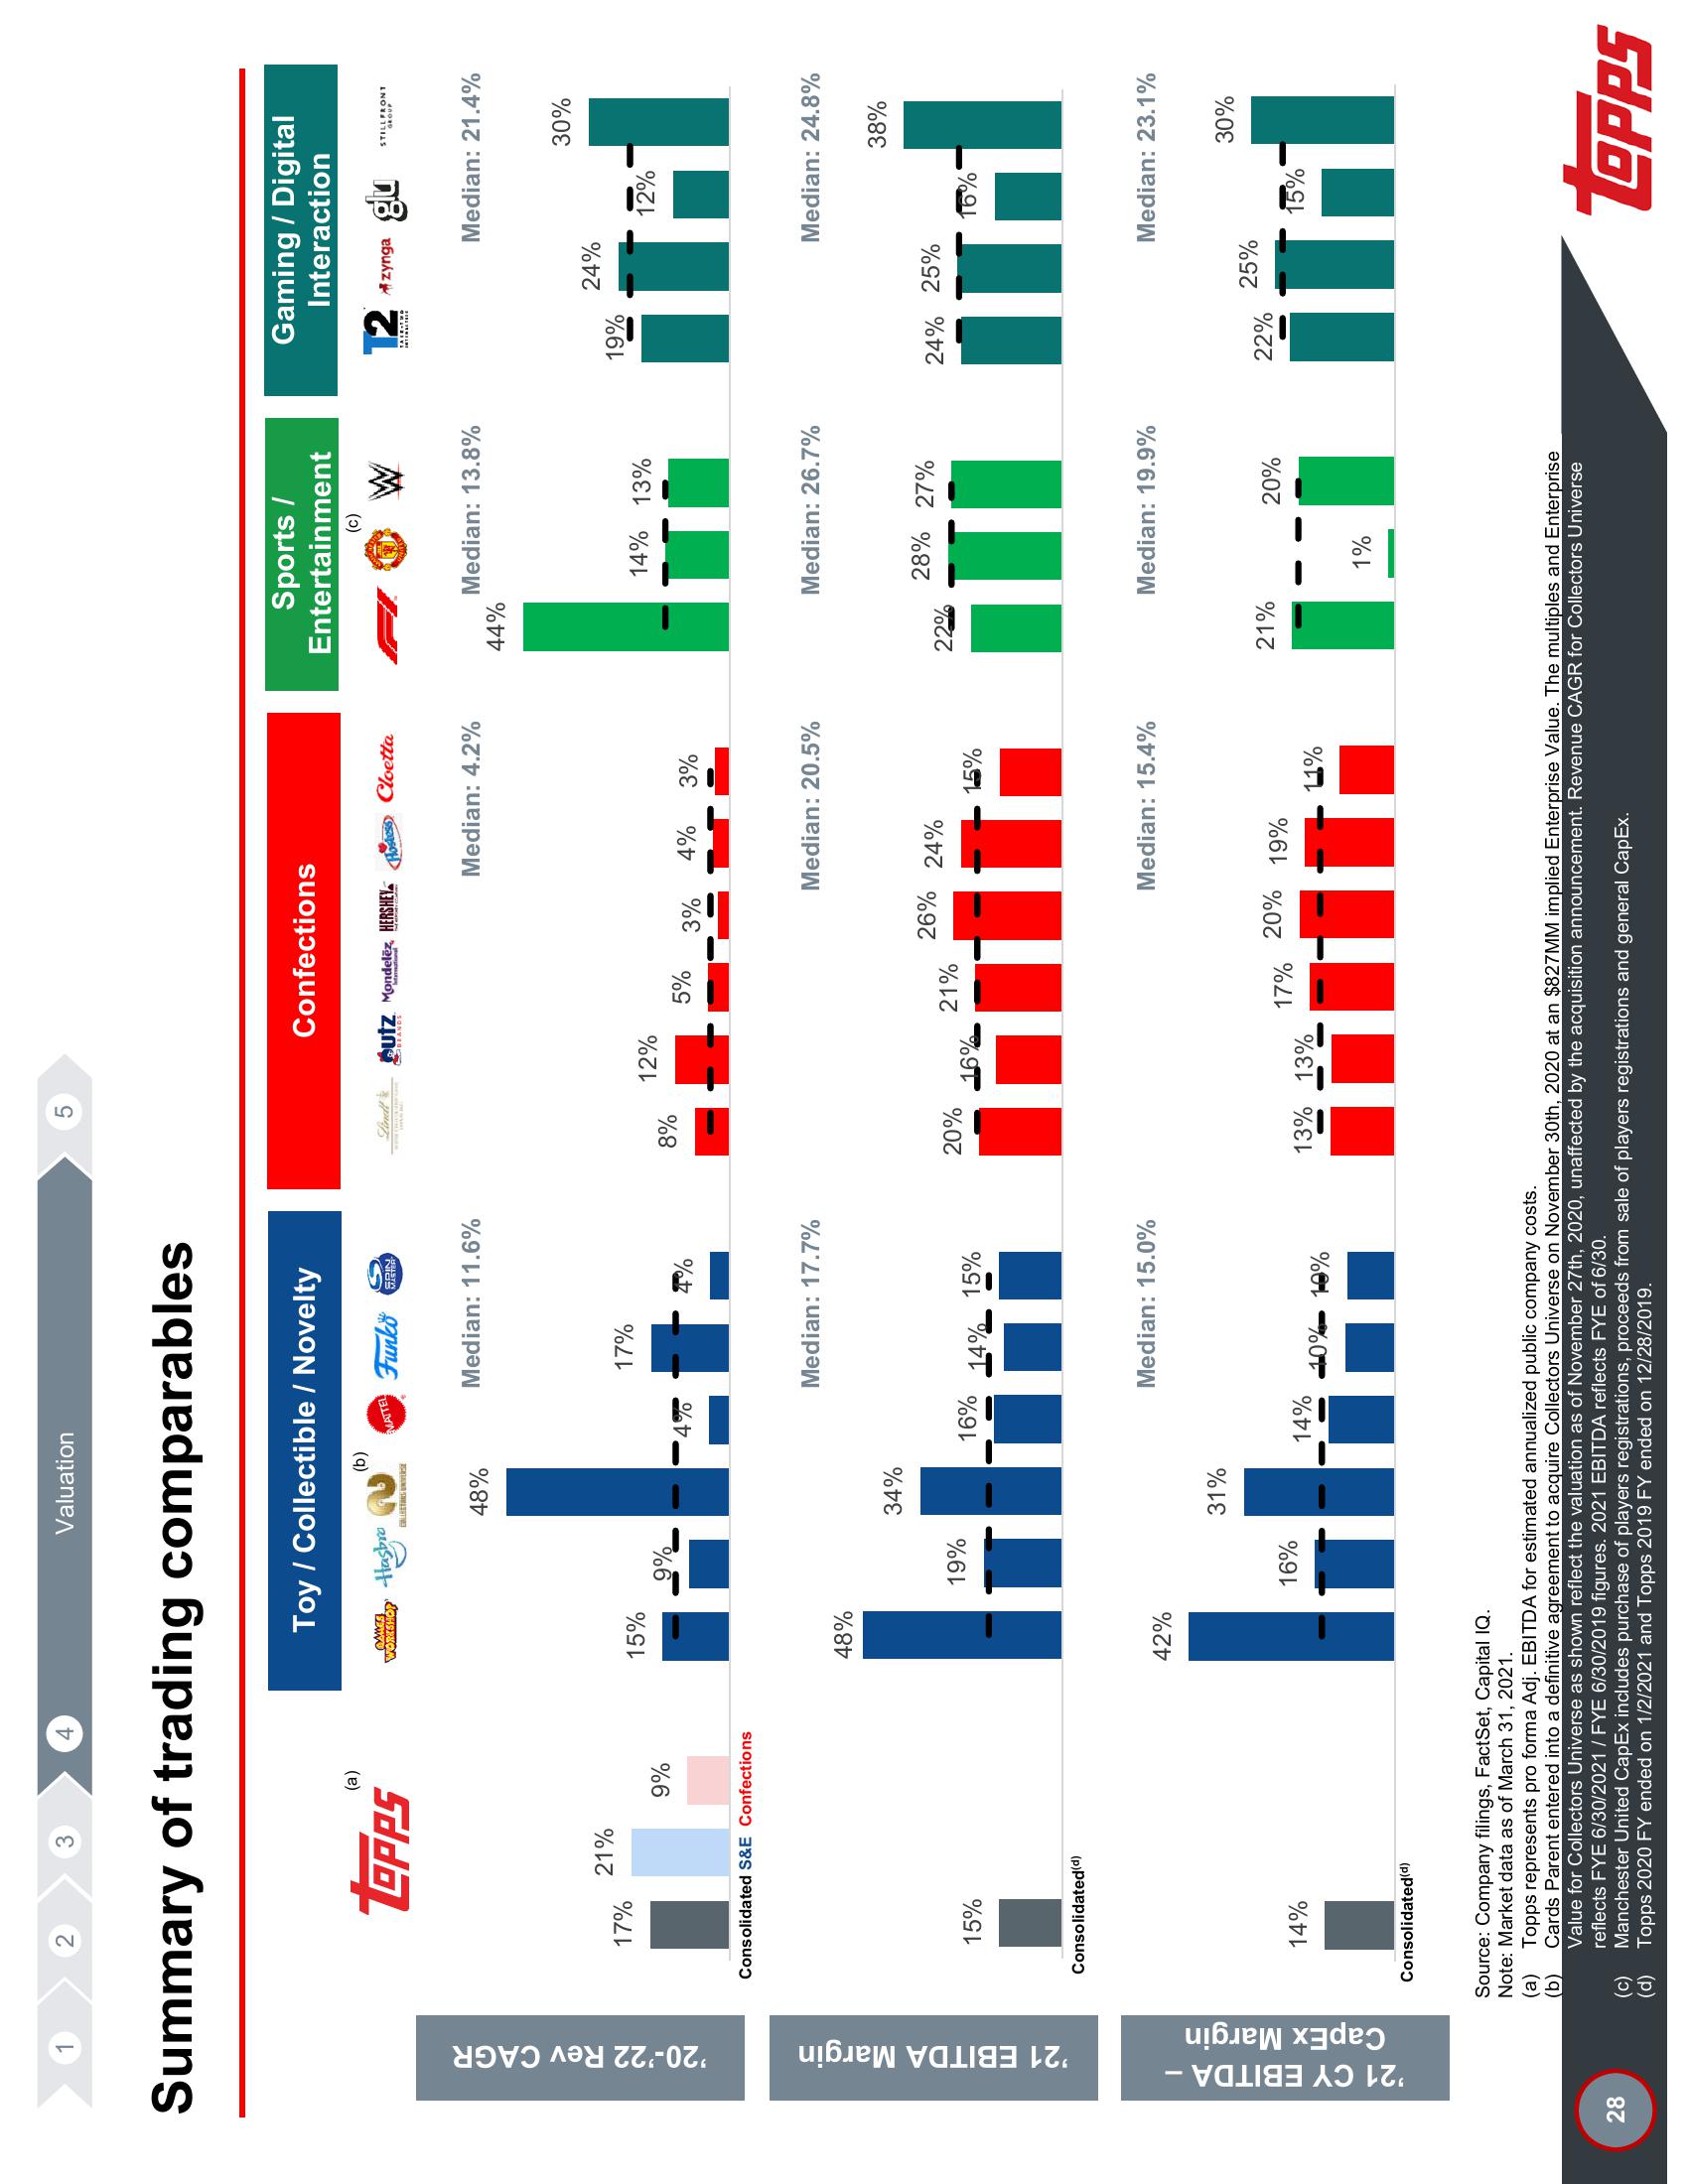
'20-'22 Rev CAGR
Summary of trading comparables
'21 EBITDA Margin
Margin
'21 CY EBITDA -
CapEx
2
topPS
17%
(a)
(b)
(c)
(d)
15%
Consolidated(d)
21%
Consolidated S&E Confections
14%
Consolidated (d)
(a)
4
9%
Toy / Collectible / Novelty
DAMES Hasbro
WORKSHOP
15%
48%
Valuation
42%
Source: Company filings, FactSet, Capital IQ.
Note: Market data as of March 31, 2021.
9%
(b)
COLLETONVER
48%
MATTEL
4%
Funko
S
Median: 11.6%
17%
4%
Median: 17.7%
Lindt
Median: 15.0%
8%
Confections
20%
utz Mondelēz, HERSHEY
BEANDS
12%
5%
3%
ostess
Cloetta
Median: 4.2%
4% 3%
Median: 20.5%
1.5%
Median: 15.4%
Sports /
Entertainment
(c)
44%
1%
W
Median: 13.8%
14% 13%
Median: 26.7%
Median: 19.9%
Gaming / Digital
Interaction
TALE-TUO
Topps represents pro forma Adj. EBITDA for estimated annualized public company costs.
Cards Parent entered into a definitive agreement to acquire Collectors Universe on November 30th, 2020 at an $827MM implied Enterprise Value. The multiples and Enterprise
Value for Collectors Universe as shown reflect the valuation as of November 27th, 2020, unaffected by the acquisition announcement. Revenue CAGR for Collectors Universe
reflects FYE 6/30/2021 / FYE 6/30/2019 figures. 2021 EBITDA reflects FYE of 6/30.
Manchester United CapEx includes purchase of players registrations, proceeds from sale of players registrations and general CapEx.
Topps 2020 FY ended on 1/2/2021 and Topps 2019 FY ended on 12/28/2019.
19%
34%
28% 27%
26% 24%
24% 25%
19%
22%
21%
16%
15%
14%
16%
16%
kika tain ill il
zynga
24%
glu
STILL FRONT
GROUP
Median: 21.4%
12%
30%
Median: 24.8%
31%
25%
21%
20%
22%
20%
17%
19%
16%
15%
14%
13% 13%
10% 1.9%
lika un 13 ini
1%
38%
Median: 23.1%
30%
LOPPSView entire presentation