Nuvei Results Presentation Deck
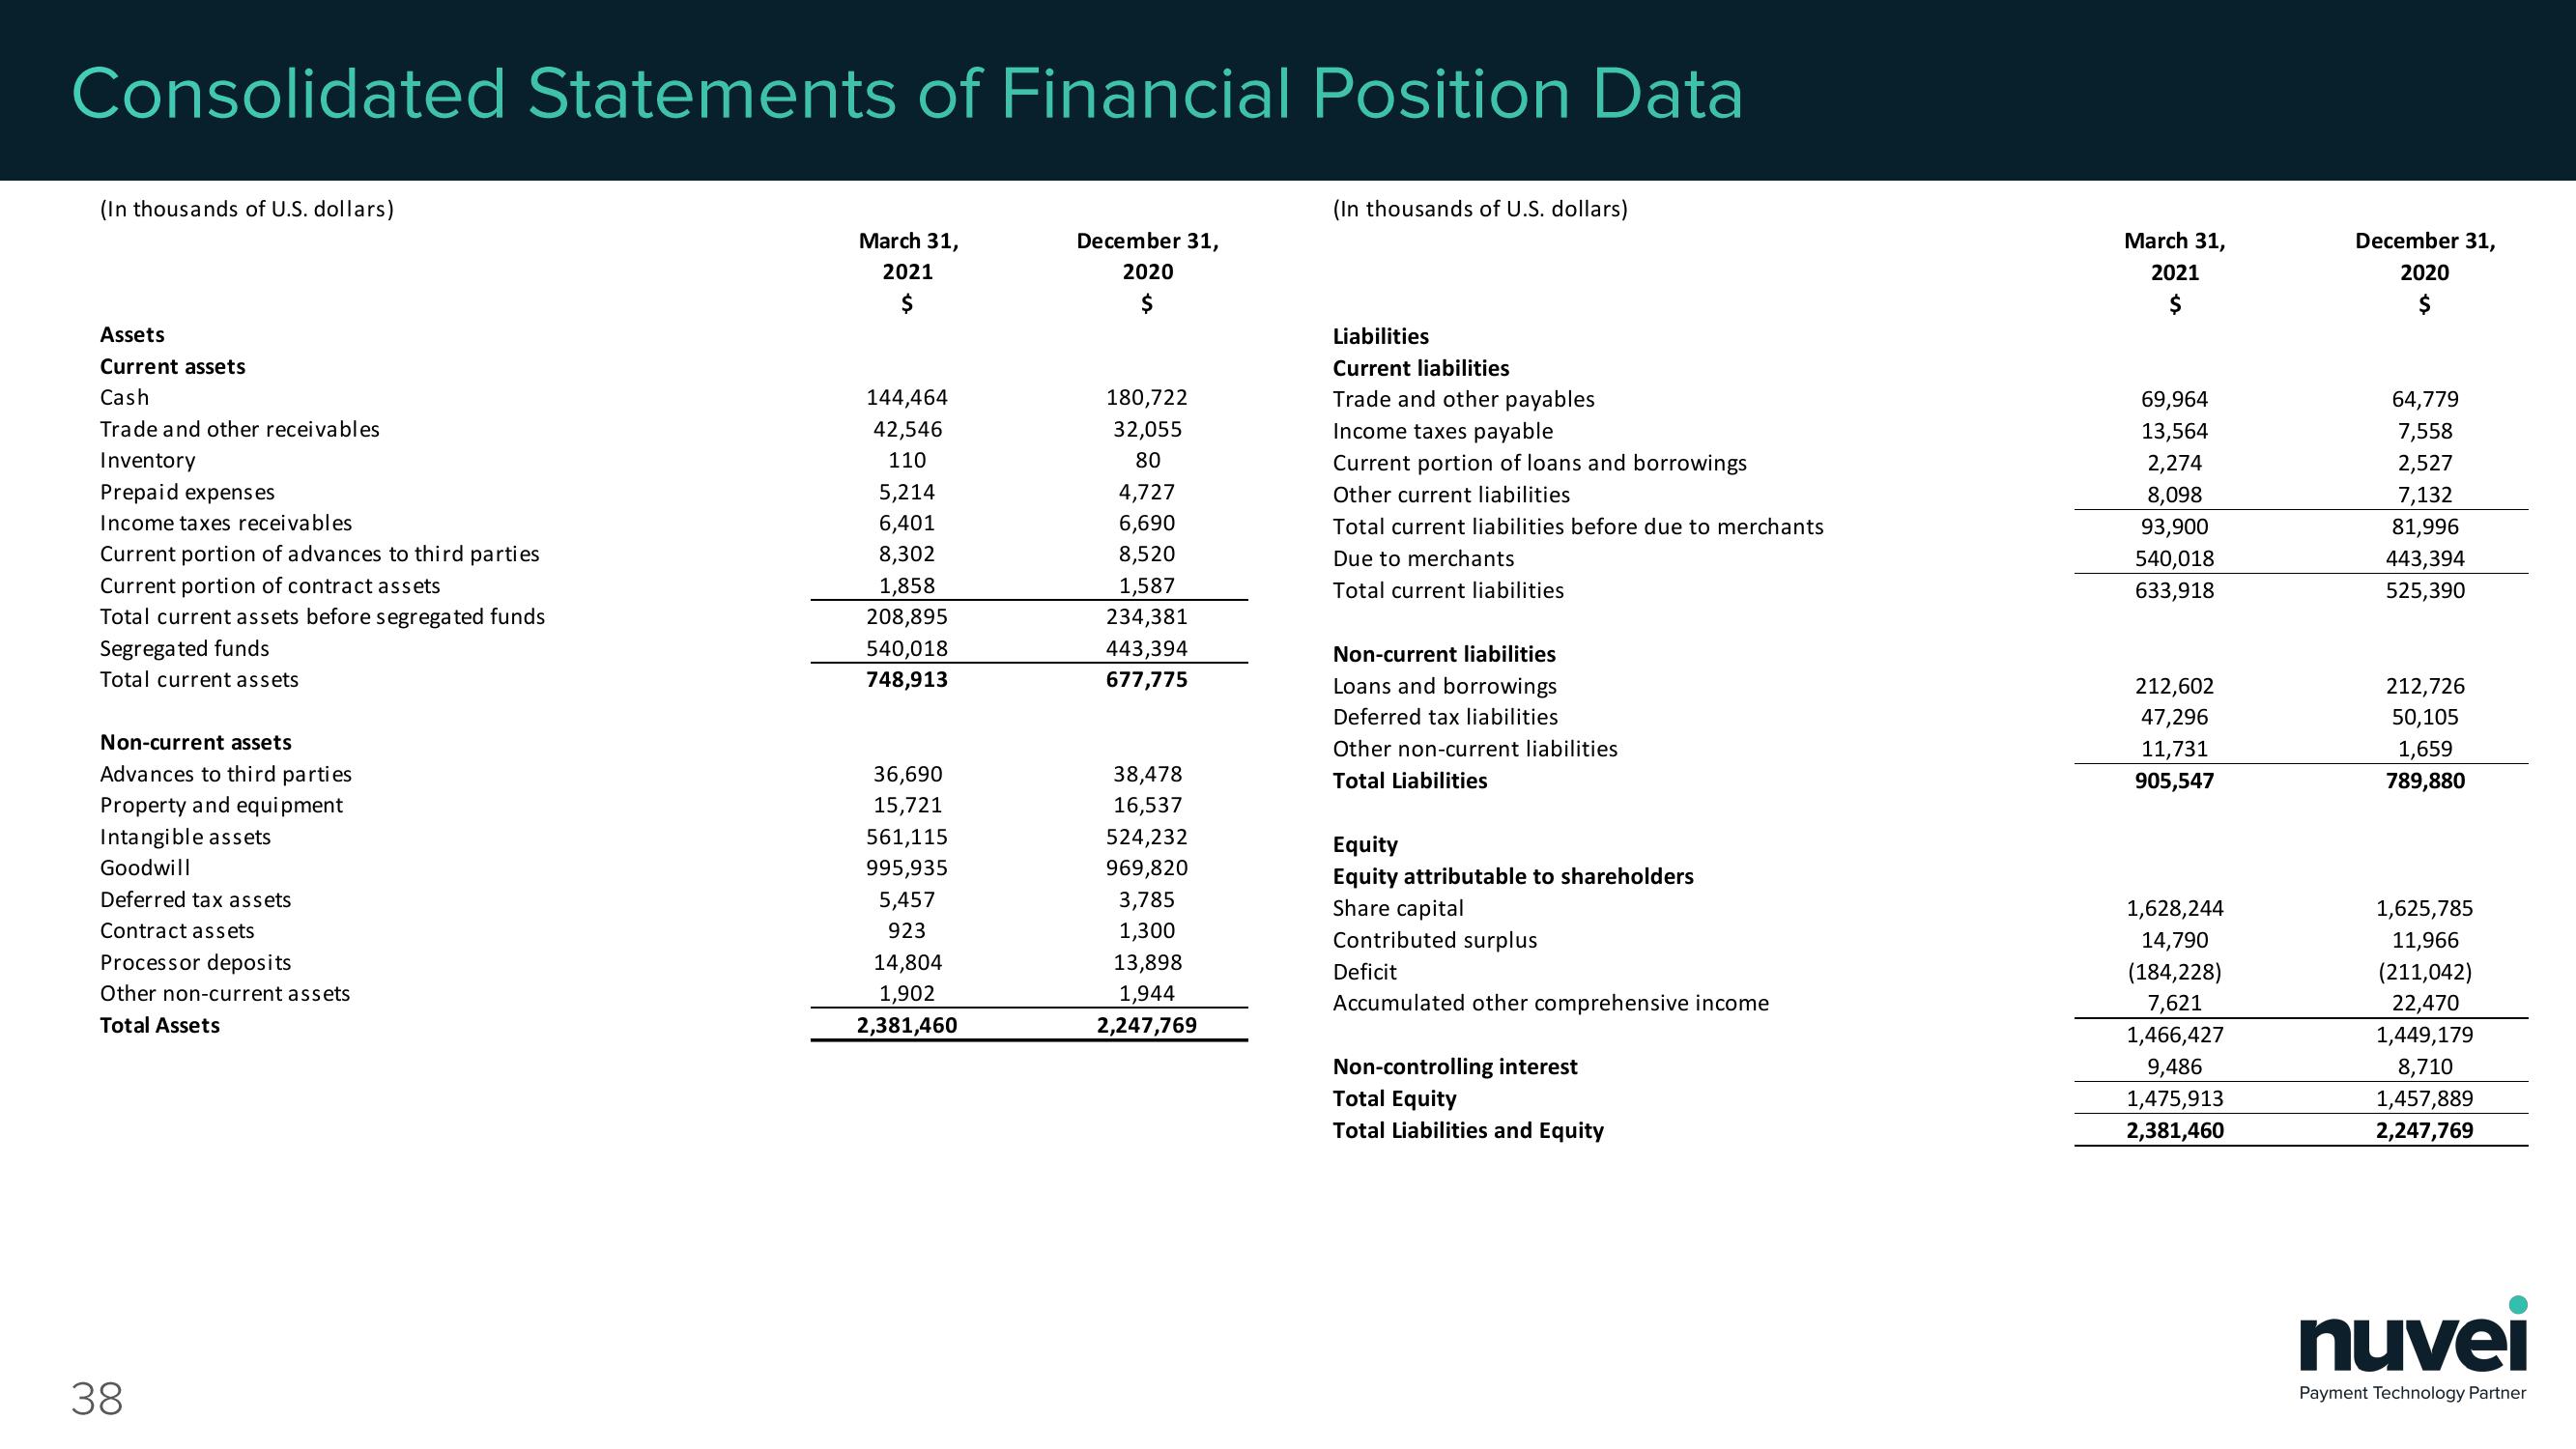
Consolidated Statements of Financial Position Data
(In thousands of U.S. dollars)
Assets
Current assets
Cash
Trade and other receivables
Inventory
Prepaid expenses
Income taxes receivables
Current portion of advances to third parties
Current portion of contract assets
Total current assets before segregated funds
Segregated funds
Total current assets
Non-current assets
Advances to third parties
Property and equipment
Intangible assets
Goodwill
Deferred tax assets
Contract assets
Processor deposits
Other non-current assets
Total Assets
38
March 31,
2021
$
144,464
42,546
110
5,214
6,401
8,302
1,858
208,895
540,018
748,913
36,690
15,721
561,115
995,935
5,457
923
14,804
1,902
2,381,460
December 31,
2020
$
180,722
32,055
80
4,727
6,690
8,520
1,587
234,381
443,394
677,775
38,478
16,537
524,232
969,820
3,785
1,300
13,898
1,944
2,247,769
(In thousands of U.S. dollars)
Liabilities
Current liabilities
Trade and other payables
Income taxes payable
Current portion of loans and borrowings
Other current liabilities
Total current liabilities before due to merchants
Due to merchants
Total current liabilities
Non-current liabilities
Loans and borrowings
Deferred tax liabilities
Other non-current liabilities
Total Liabilities
Equity
Equity attributable to shareholders
Share capital
Contributed surplus
Deficit
Accumulated other comprehensive income
Non-controlling interest
Total Equity
Total Liabilities and Equity
March 31,
2021
$
69,964
13,564
2,274
8,098
93,900
540,018
633,918
212,602
47,296
11,731
905,547
1,628,244
14,790
(184,228)
7,621
1,466,427
9,486
1,475,913
2,381,460
December 31,
2020
$
64,779
7,558
2,527
7,132
81,996
443,394
525,390
212,726
50,105
1,659
789,880
1,625,785
11,966
(211,042)
22,470
1,449,179
8,710
1,457,889
2,247,769
nuvei
Payment Technology PartnerView entire presentation