HSBC Investor Day Presentation Deck
£m
Net interest income
Non interest income
Revenue
ECL
Costs
Adjusted PBT
Significant items
Reported PBT
Reported ROTE, %
Adjusted ROTE, %²
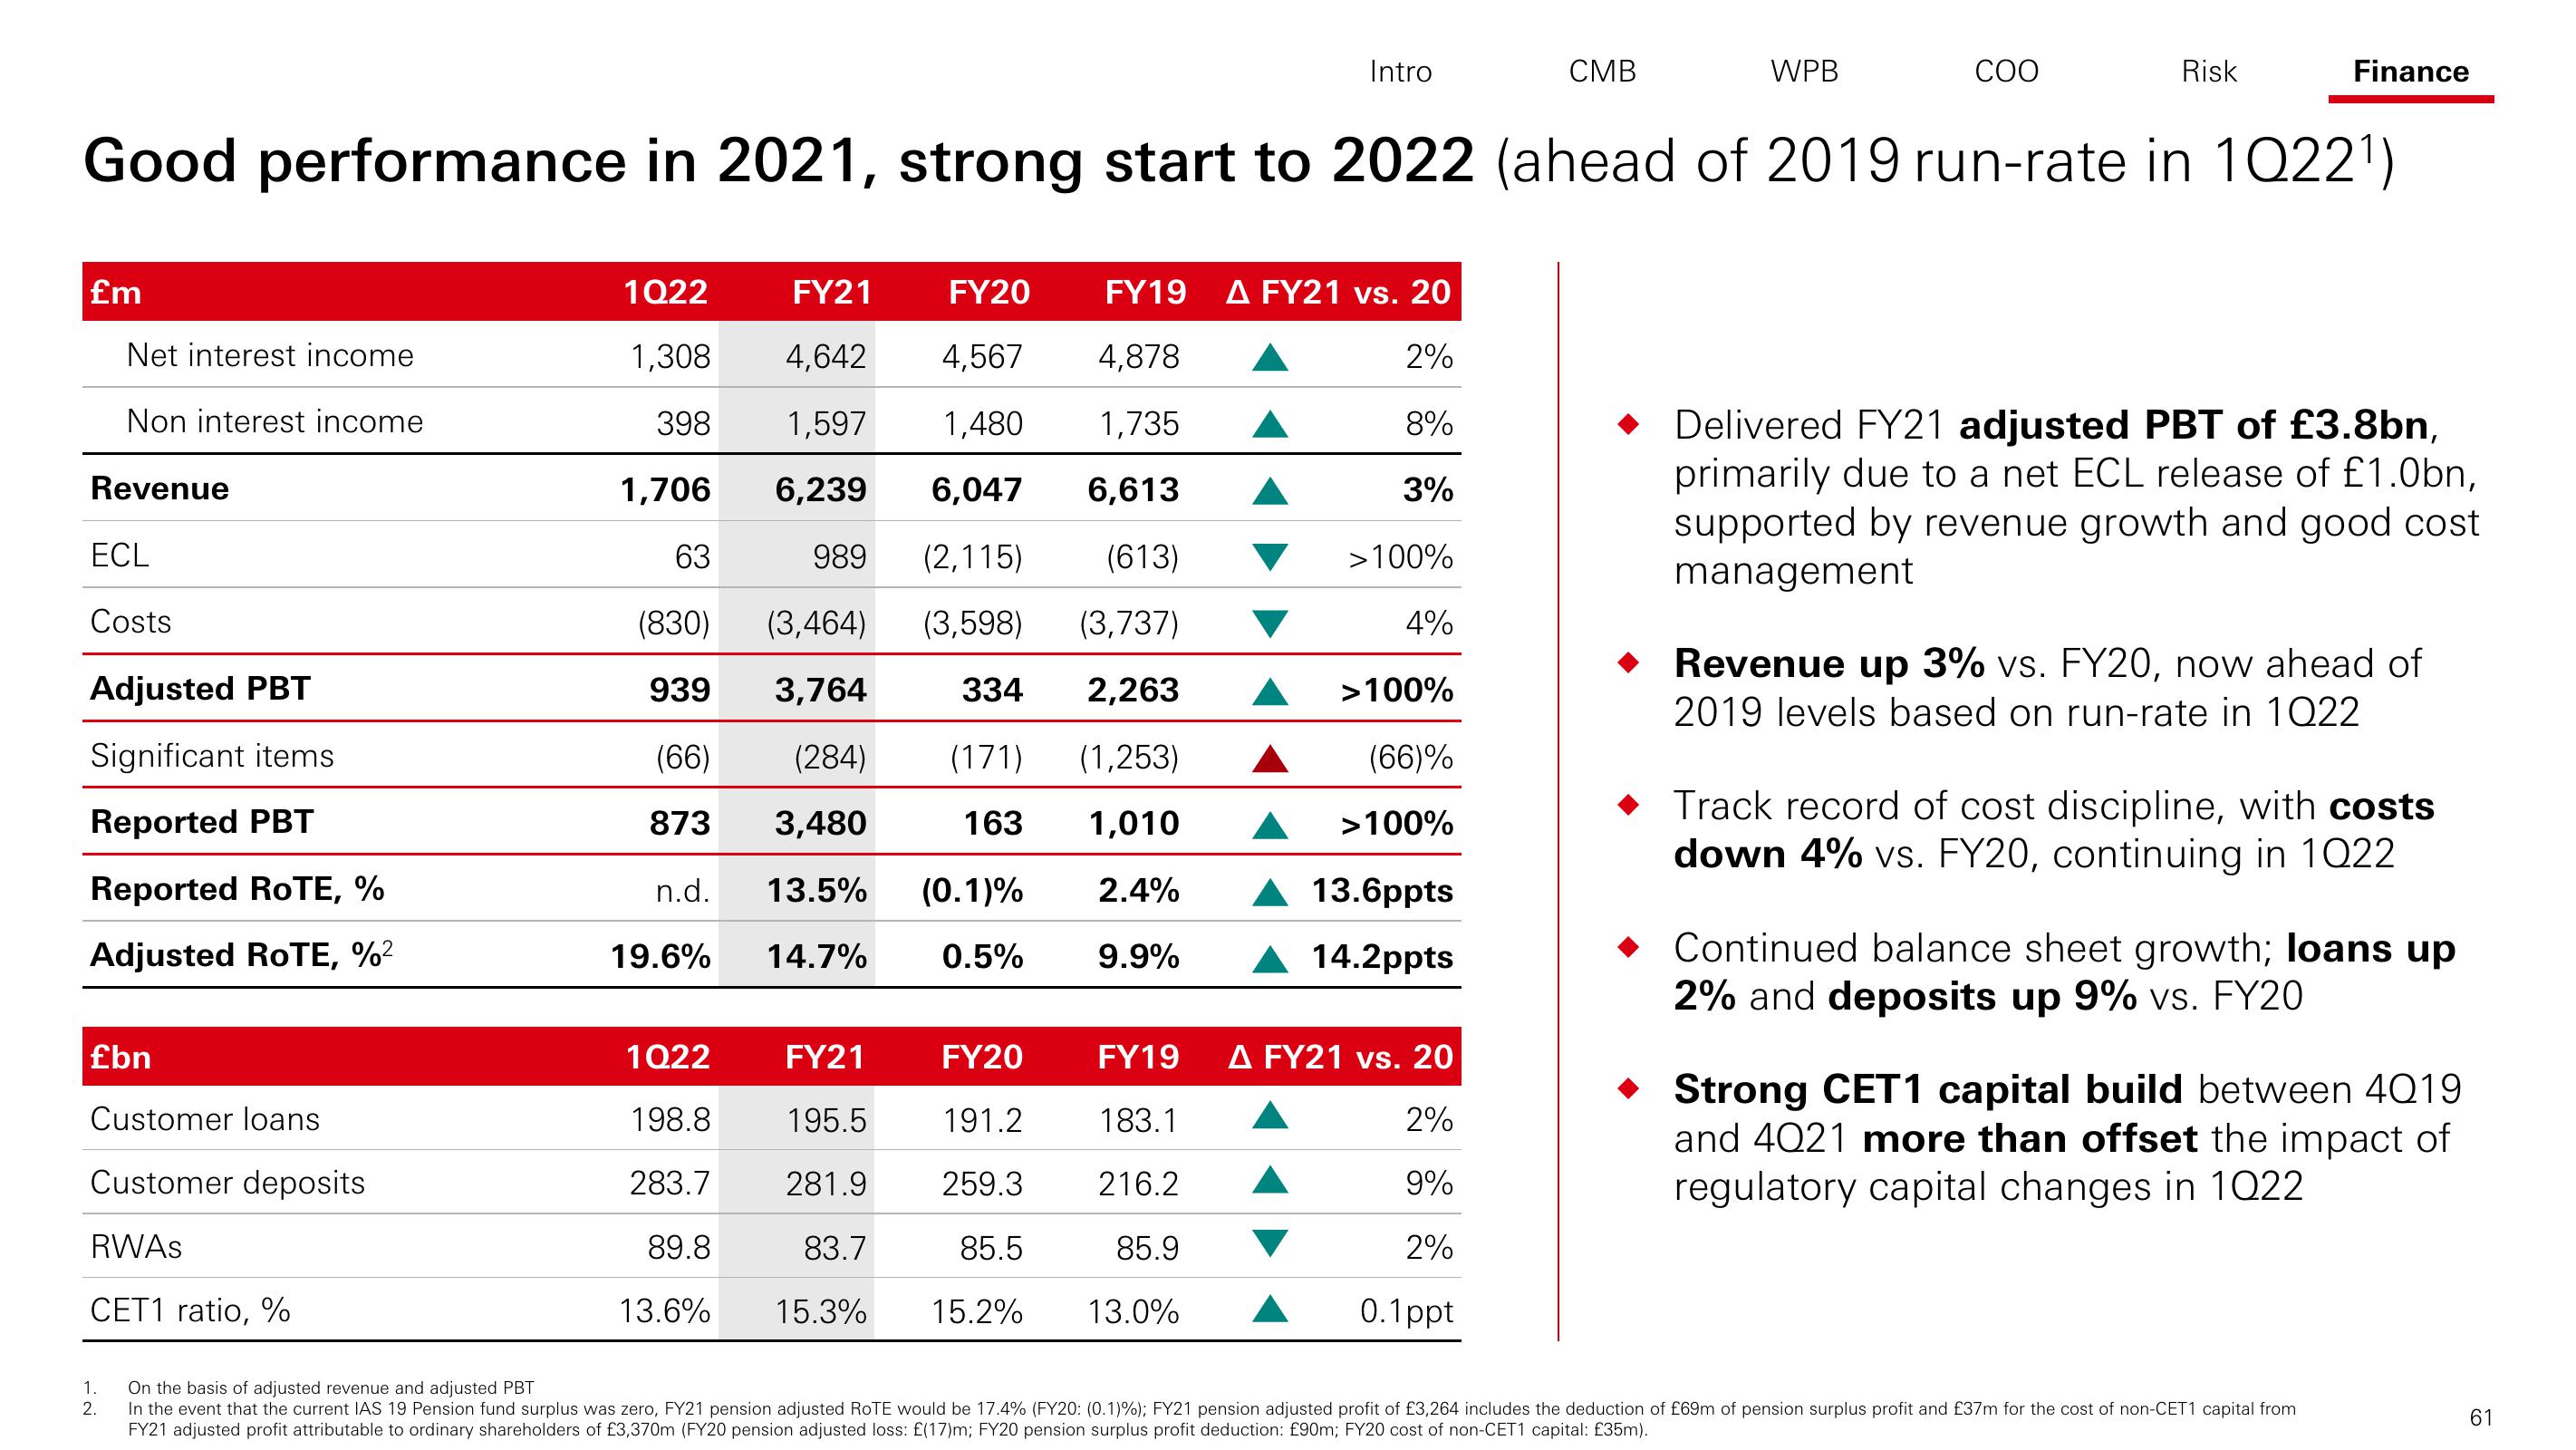
Good performance in 2021, strong start to 2022 (ahead of 2019 run-rate in 1Q22¹)
£bn
Customer loans
Customer deposits
RWAS
CET1 ratio, %
1.
2.
1Q22
FY21
FY20
FY19
1,308
4,642
4,567 4,878
398
1,597
1,480
1,735
1,706
6,239 6,047 6,613
63
989 (2,115)
(613)
(830)
(3,464) (3,598) (3,737)
939 3,764
334 2,263
(66)
873
(284) (171) (1,253)
163 1,010
3,480
n.d. 13.5% (0.1)% 2.4%
19.6%
14.7%
0.5%
9.9%
1Q22
198.8
283.7
89.8
13.6%
FY21
195.5
281.9
83.7
15.3%
Intro
FY20
191.2
259.3
85.5
15.2%
A FY21 vs. 20
2%
8%
3%
>100%
4%
>100%
(66)%
>100%
13.6ppts
14.2ppts
CMB
FY19 A FY21 vs. 20
183.1
2%
216.2
9%
85.9
2%
13.0%
0.1ppt
WPB
COO
Risk
Finance
◆ Delivered FY21 adjusted PBT of £3.8bn,
primarily due to a net ECL release of £1.0bn,
supported by revenue growth and good cost
management
◆ Revenue up 3% vs. FY20, now ahead of
2019 levels based on run-rate in 1022
◆ Track record of cost discipline, with costs
down 4% vs. FY20, continuing in 1022
Continued balance sheet growth; loans up
2% and deposits up 9% vs. FY20
◆ Strong CET1 capital build between 4019
and 4021 more than offset the impact of
regulatory capital changes in 1022
On the basis of adjusted revenue and adjusted PBT
In the event that the current IAS 19 Pension fund surplus was zero, FY21 pension adjusted ROTE would be 17.4% (FY20: (0.1) %); FY21 pension adjusted profit of £3,264 includes the deduction of £69m of pension surplus profit and £37m for the cost of non-CET1 capital from
FY21 adjusted profit attributable to ordinary shareholders of £3,370m (FY20 pension adjusted loss: £(17)m; FY20 pension surplus profit deduction: £90m; FY20 cost of non-CET1 capital: £35m).
61View entire presentation