MSR Value Growth & Market Trends
ABOVE 15% CAPITAL TARGET PRO FORMA FOR REVERSE SALE
15%+ Target
13.4%
10.1%
3Q'20
●
●
13.2%
9.8%
4Q'20
Tangible Net Worth/Assets (1)
14.7%
11.2%
1Q'21
Excluding loans
subject to
repurchase
from GNMA
16.8%
15 (¹)Please see appendix for reconciliations of non-GAAP measures
13.8%
2Q'21
16.6%
14.5%
3Q'21
20.7%
17.5%
3Q'21 Pro Forma
For Reverse Sale
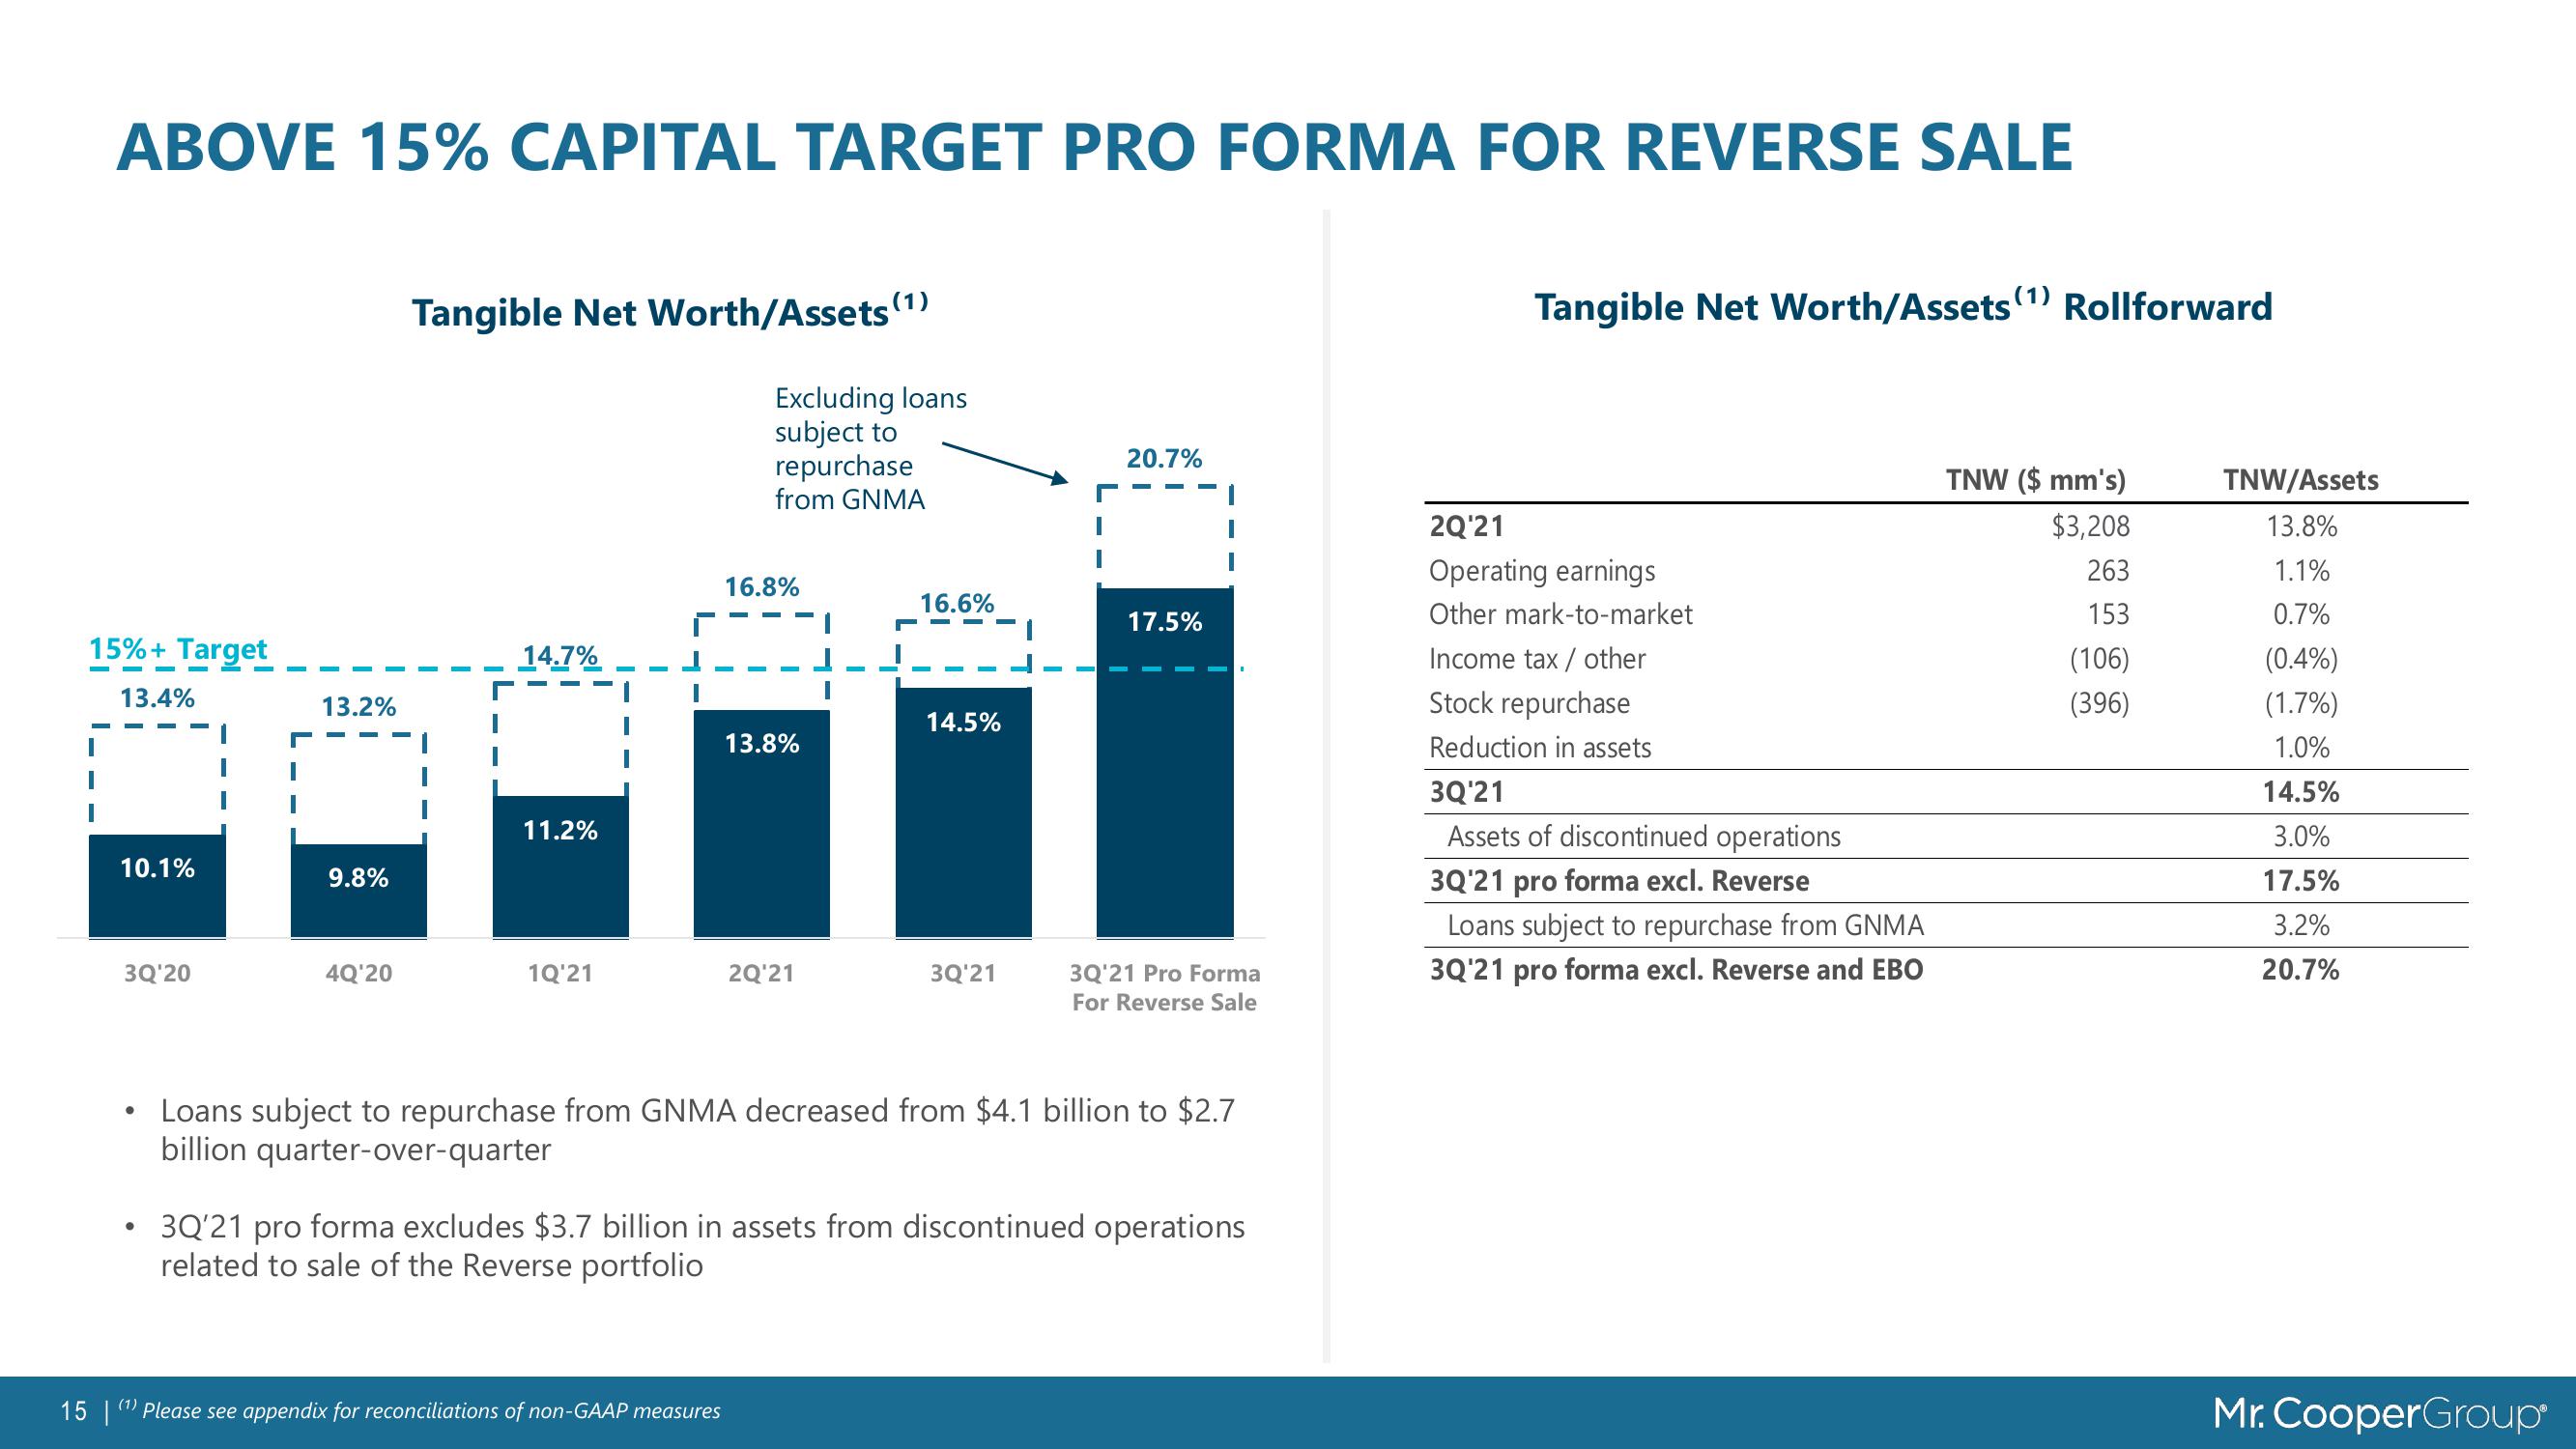
Loans subject to repurchase from GNMA decreased from $4.1 billion to $2.7
billion quarter-over-quarter
3Q'21 pro forma excludes $3.7 billion in assets from discontinued operations
related to sale of the Reverse portfolio
Tangible Net Worth/Assets (1) Rollforward
2Q¹21
Operating earnings
Other mark-to-market
Income tax / other
Stock repurchase
Reduction in assets
3Q'21
Assets of discontinued operations
3Q'21 pro forma excl. Reverse
Loans subject to repurchase from GNMA
3Q'21 pro forma excl. Reverse and EBO
TNW ($ mm's)
$3,208
263
153
(106)
(396)
TNW/Assets
13.8%
1.1%
0.7%
(0.4%)
(1.7%)
1.0%
14.5%
3.0%
17.5%
3.2%
20.7%
Mr. CooperGroupView entire presentation