System1 SPAC Presentation Deck
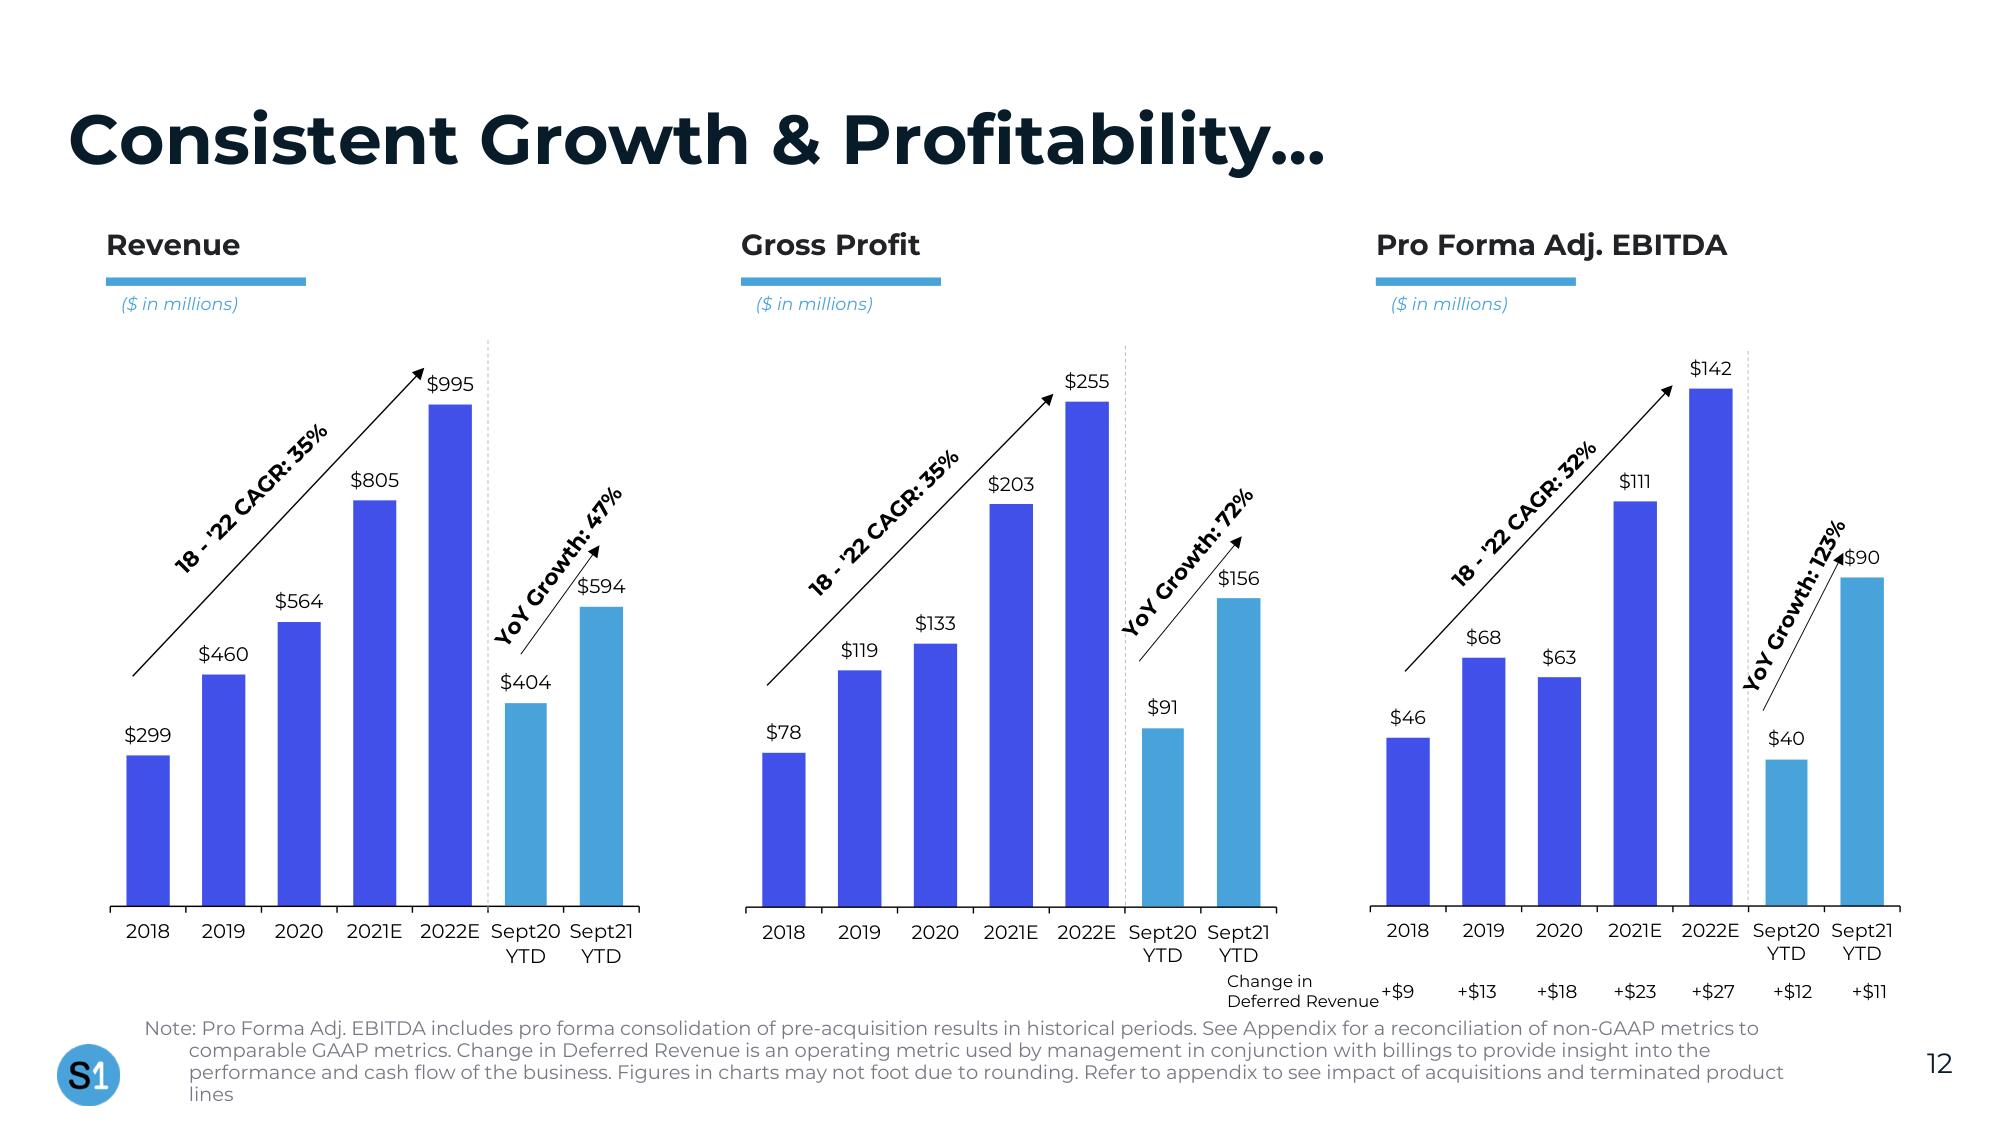
Consistent Growth & Profitability...
Revenue
S1
($ in millions)
$299
$460
18-¹22 CAGR: 35%
$564
$805
$995
$404
YOY Growth: 47%
$594
2018 2019 2020 2021E 2022E Sept20 Sept21
YTD YTD
Gross Profit
($ in millions)
$78
18-¹22 CAGR: 35%
$119
$203
$133
$255
$91
YOY Growth: 72%
→
$156
Pro Forma Adj. EBITDA
2018 2019 2020 2021E 2022E Sept20 Sept21
YTD YTD
Change in
Deferred Revenue
($ in millions)
$46
$68
$63
18-¹22 CAGR: 32%
$111
2018 2019 2020
$142
$40
YOY Growth: 123%
2021E 2022E Sept20 Sept21
YTD YTD
+$9 +$13 +$18 +$23 +$27 +$12 +$11
Note: Pro Forma Adj. EBITDA includes pro forma consolidation of pre-acquisition results in historical periods. See Appendix for a reconciliation of non-GAAP metrics to
comparable GAAP metrics. Change in Deferred Revenue is an operating metric used by management in conjunction with billings to provide insight into the
performance and cash flow of the business. Figures in charts may not foot due to rounding. Refer to appendix to see impact of acquisitions and terminated product
lines
1$90
12View entire presentation