Tesla Results Presentation Deck
9
OTHER HIGHLIGHTS
Energy Storage
Energy storage deployments decreased by 11% YoY in Q2 to 1.1 GWh, mainly due to
semiconductor challenges, which are having a greater impact on our Energy
business than our Automotive business. Demand for our storage products remains in
excess of our ability to supply. We are in the process of ramping production at our
dedicated Megapack factory to address the growing demand.
Solar
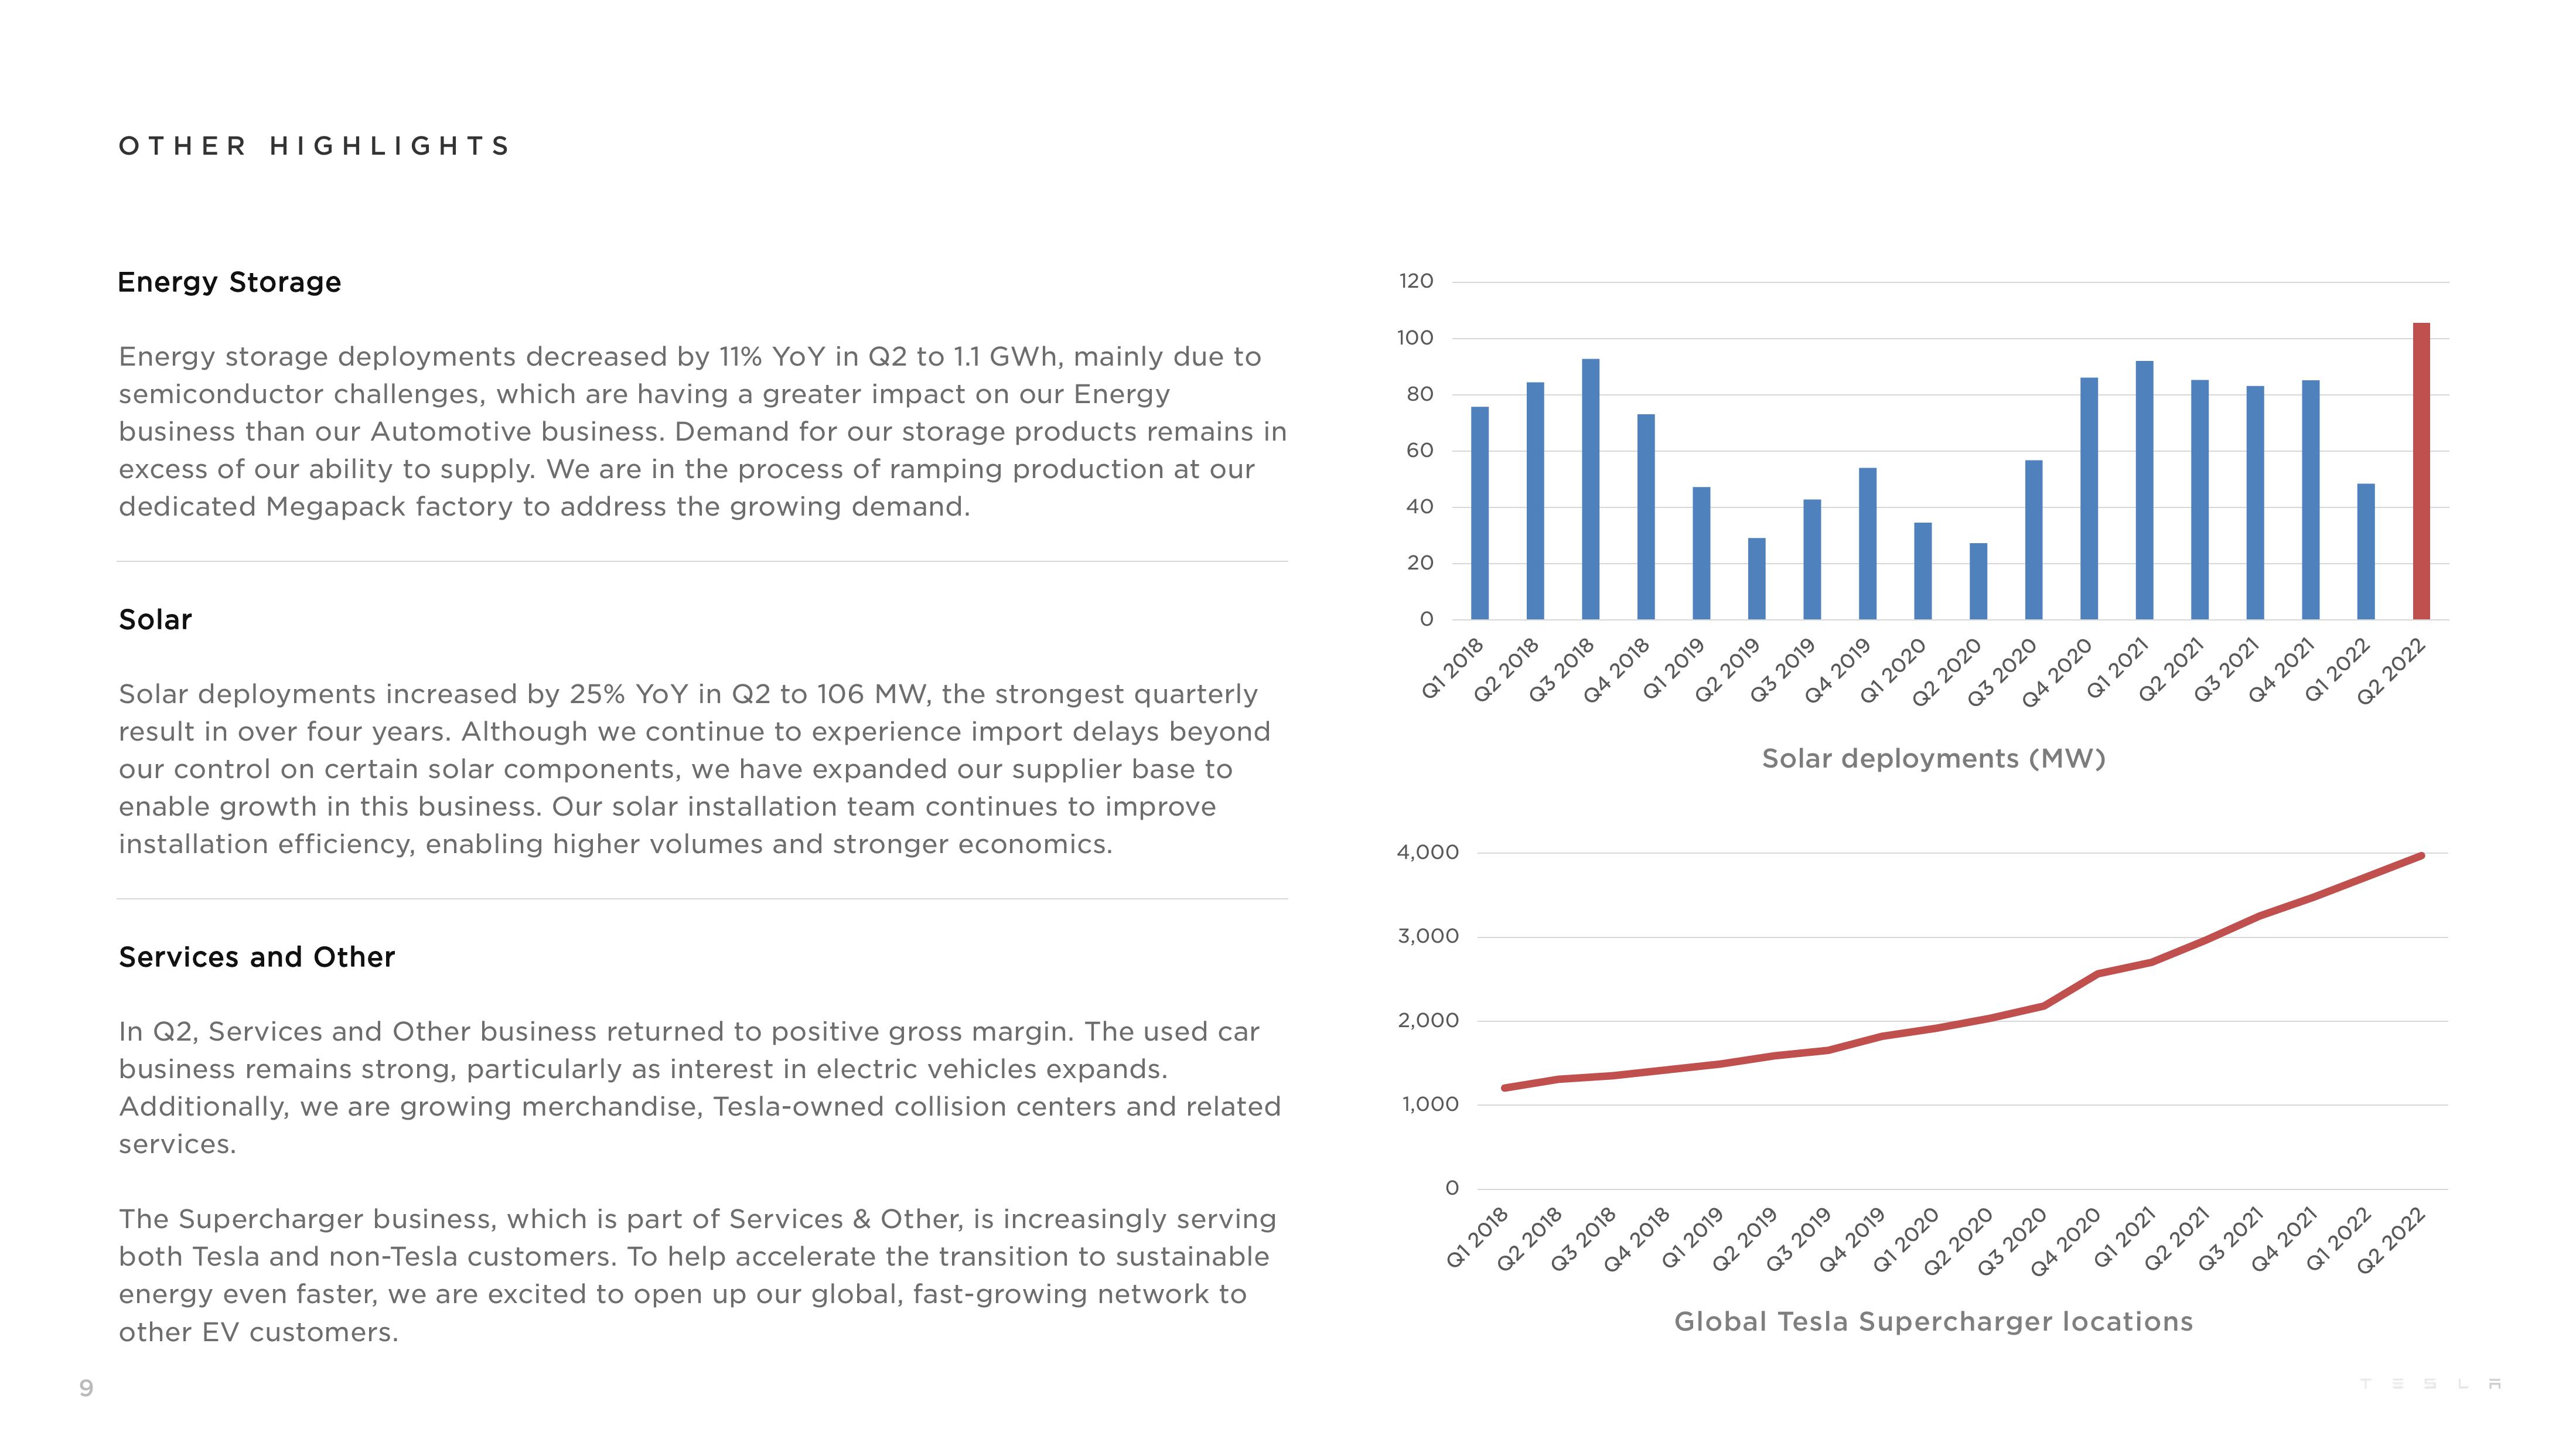
Solar deployments increased by 25% YoY in Q2 to 106 MW, the strongest quarterly
result in over four years. Although we continue to experience import delays beyond
our control on certain solar components, we have expanded our supplier base to
enable growth in this business. Our solar installation team continues to improve
installation efficiency, enabling higher volumes and stronger economics.
Services and Other
In Q2, Services and Other business returned to positive gross margin. The used car
business remains strong, particularly as interest in electric vehicles expands.
Additionally, we are growing merchandise, Tesla-owned collision centers and related
services.
The Supercharger business, which is part of Services & Other, is increasingly serving
both Tesla and non-Tesla customers. To help accelerate the transition to sustainable
energy even faster, we are excited to open up our global, fast-growing network to
other EV customers.
120
100
80
60
40
20
O
Q1 2018
4,000
3,000
2,000
1,000
O
Q2 2018
Q1 2018
Q3 2018
Q4 2018
Q2 2018
Q3 2018
Q1 2019
Q2 2019
Q1 2019
Q4 2018
H
Q3 2019
Q2 2019
Q4 2019
Q1 2020
Q3 2019
Q2 2020
Q4 2019
Solar deployments (MW)
Q1 2020
Q3 2020
Q2 2020
Q3 2020
Q4 2020
Q1 2021
Q4 2020
Q2 2021
Q1 2021
Q3 2021
Q2 2021
Global Tesla Supercharger locations
Q3 2021
Q4 2021
Q4 2021
Q1 2022
Q2 2022
Q1 2022
Q2 2022
TESLAView entire presentation