Jefferies Financial Group Investor Presentation Deck
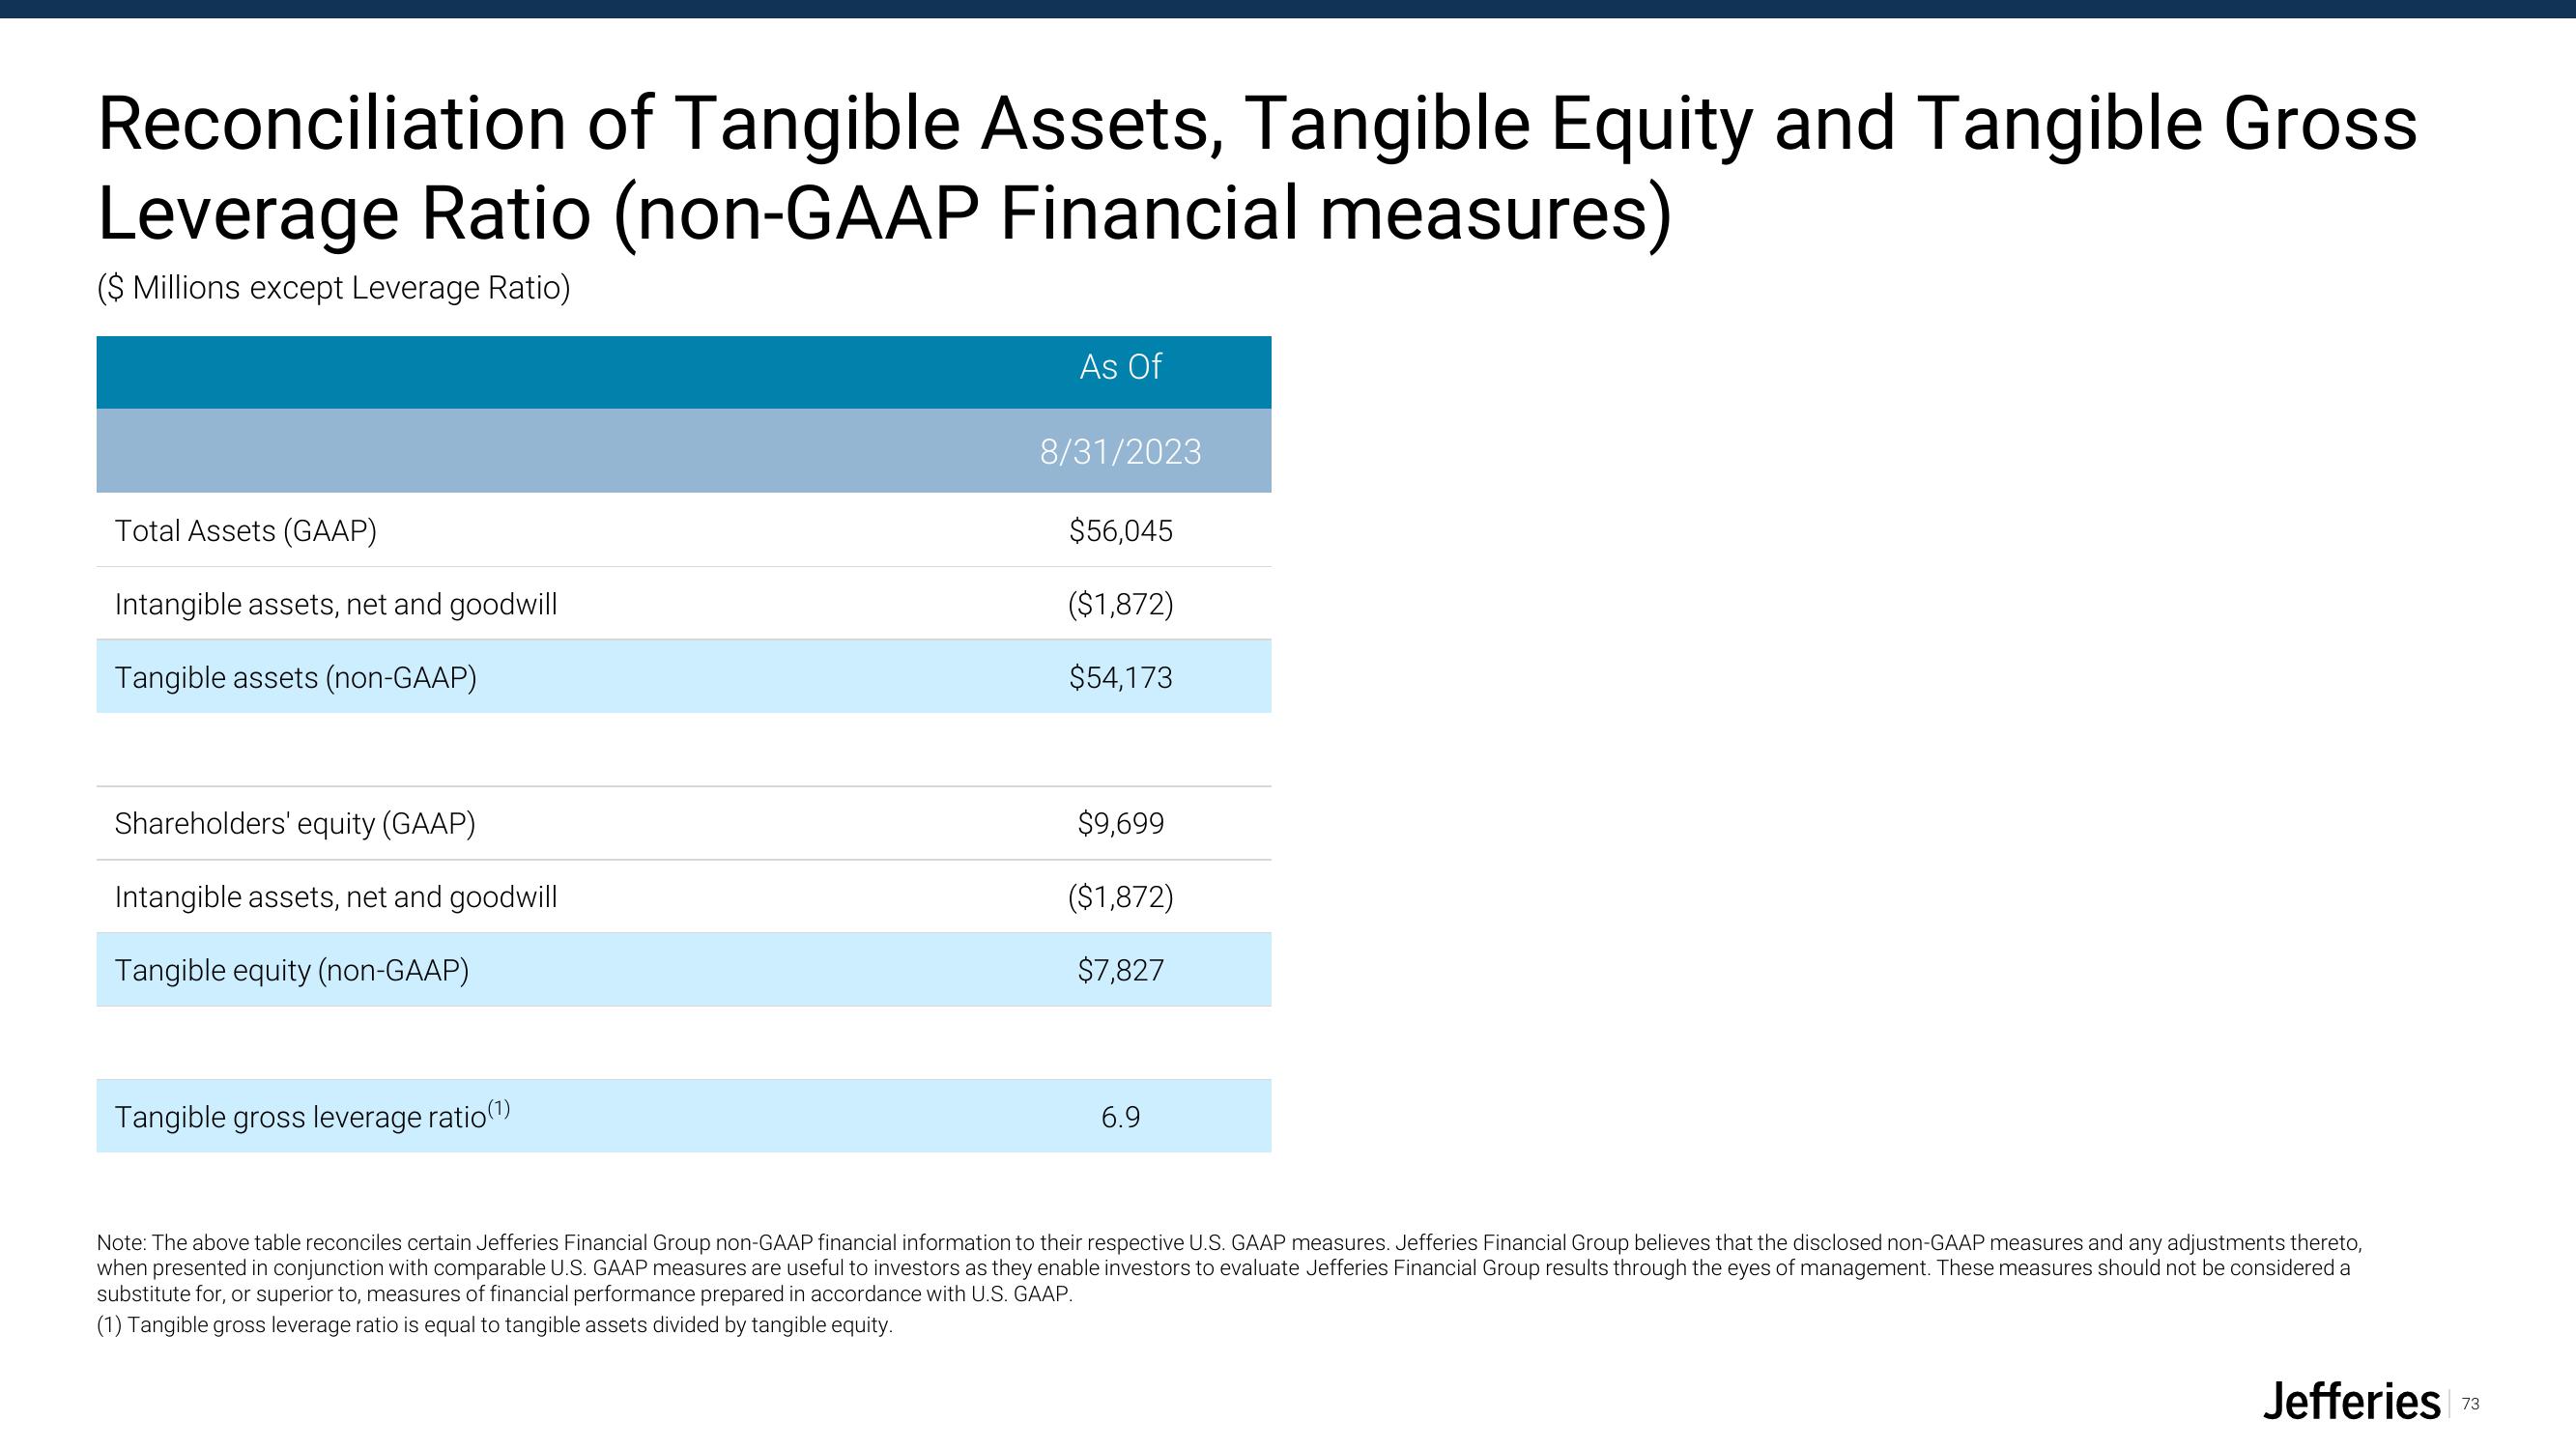
Reconciliation of Tangible Assets, Tangible Equity and Tangible Gross
Leverage Ratio (non-GAAP Financial measures)
($ Millions except Leverage Ratio)
Total Assets (GAAP)
Intangible assets, net and goodwill
Tangible assets (non-GAAP)
Shareholders' equity (GAAP)
Intangible assets, net and goodwill
Tangible equity (non-GAAP)
Tangible gross leverage ratio (¹)
As Of
8/31/2023
$56,045
($1,872)
$54,173
$9,699
($1,872)
$7,827
6.9
Note: The above table reconciles certain Jefferies Financial Group non-GAAP financial information to their respective U.S. GAAP measures. Jefferies Financial Group believes that the disclosed non-GAAP measures and any adjustments thereto,
when presented in conjunction with comparable U.S. GAAP measures are useful to investors as they enable investors to evaluate Jefferies Financial Group results through the eyes of management. These measures should not be considered a
substitute for, or superior to, measures of financial performance prepared in accordance with U.S. GAAP.
(1) Tangible gross leverage ratio is equal to tangible assets divided by tangible equity.
Jefferies
73View entire presentation