WeWork Investor Presentation Deck
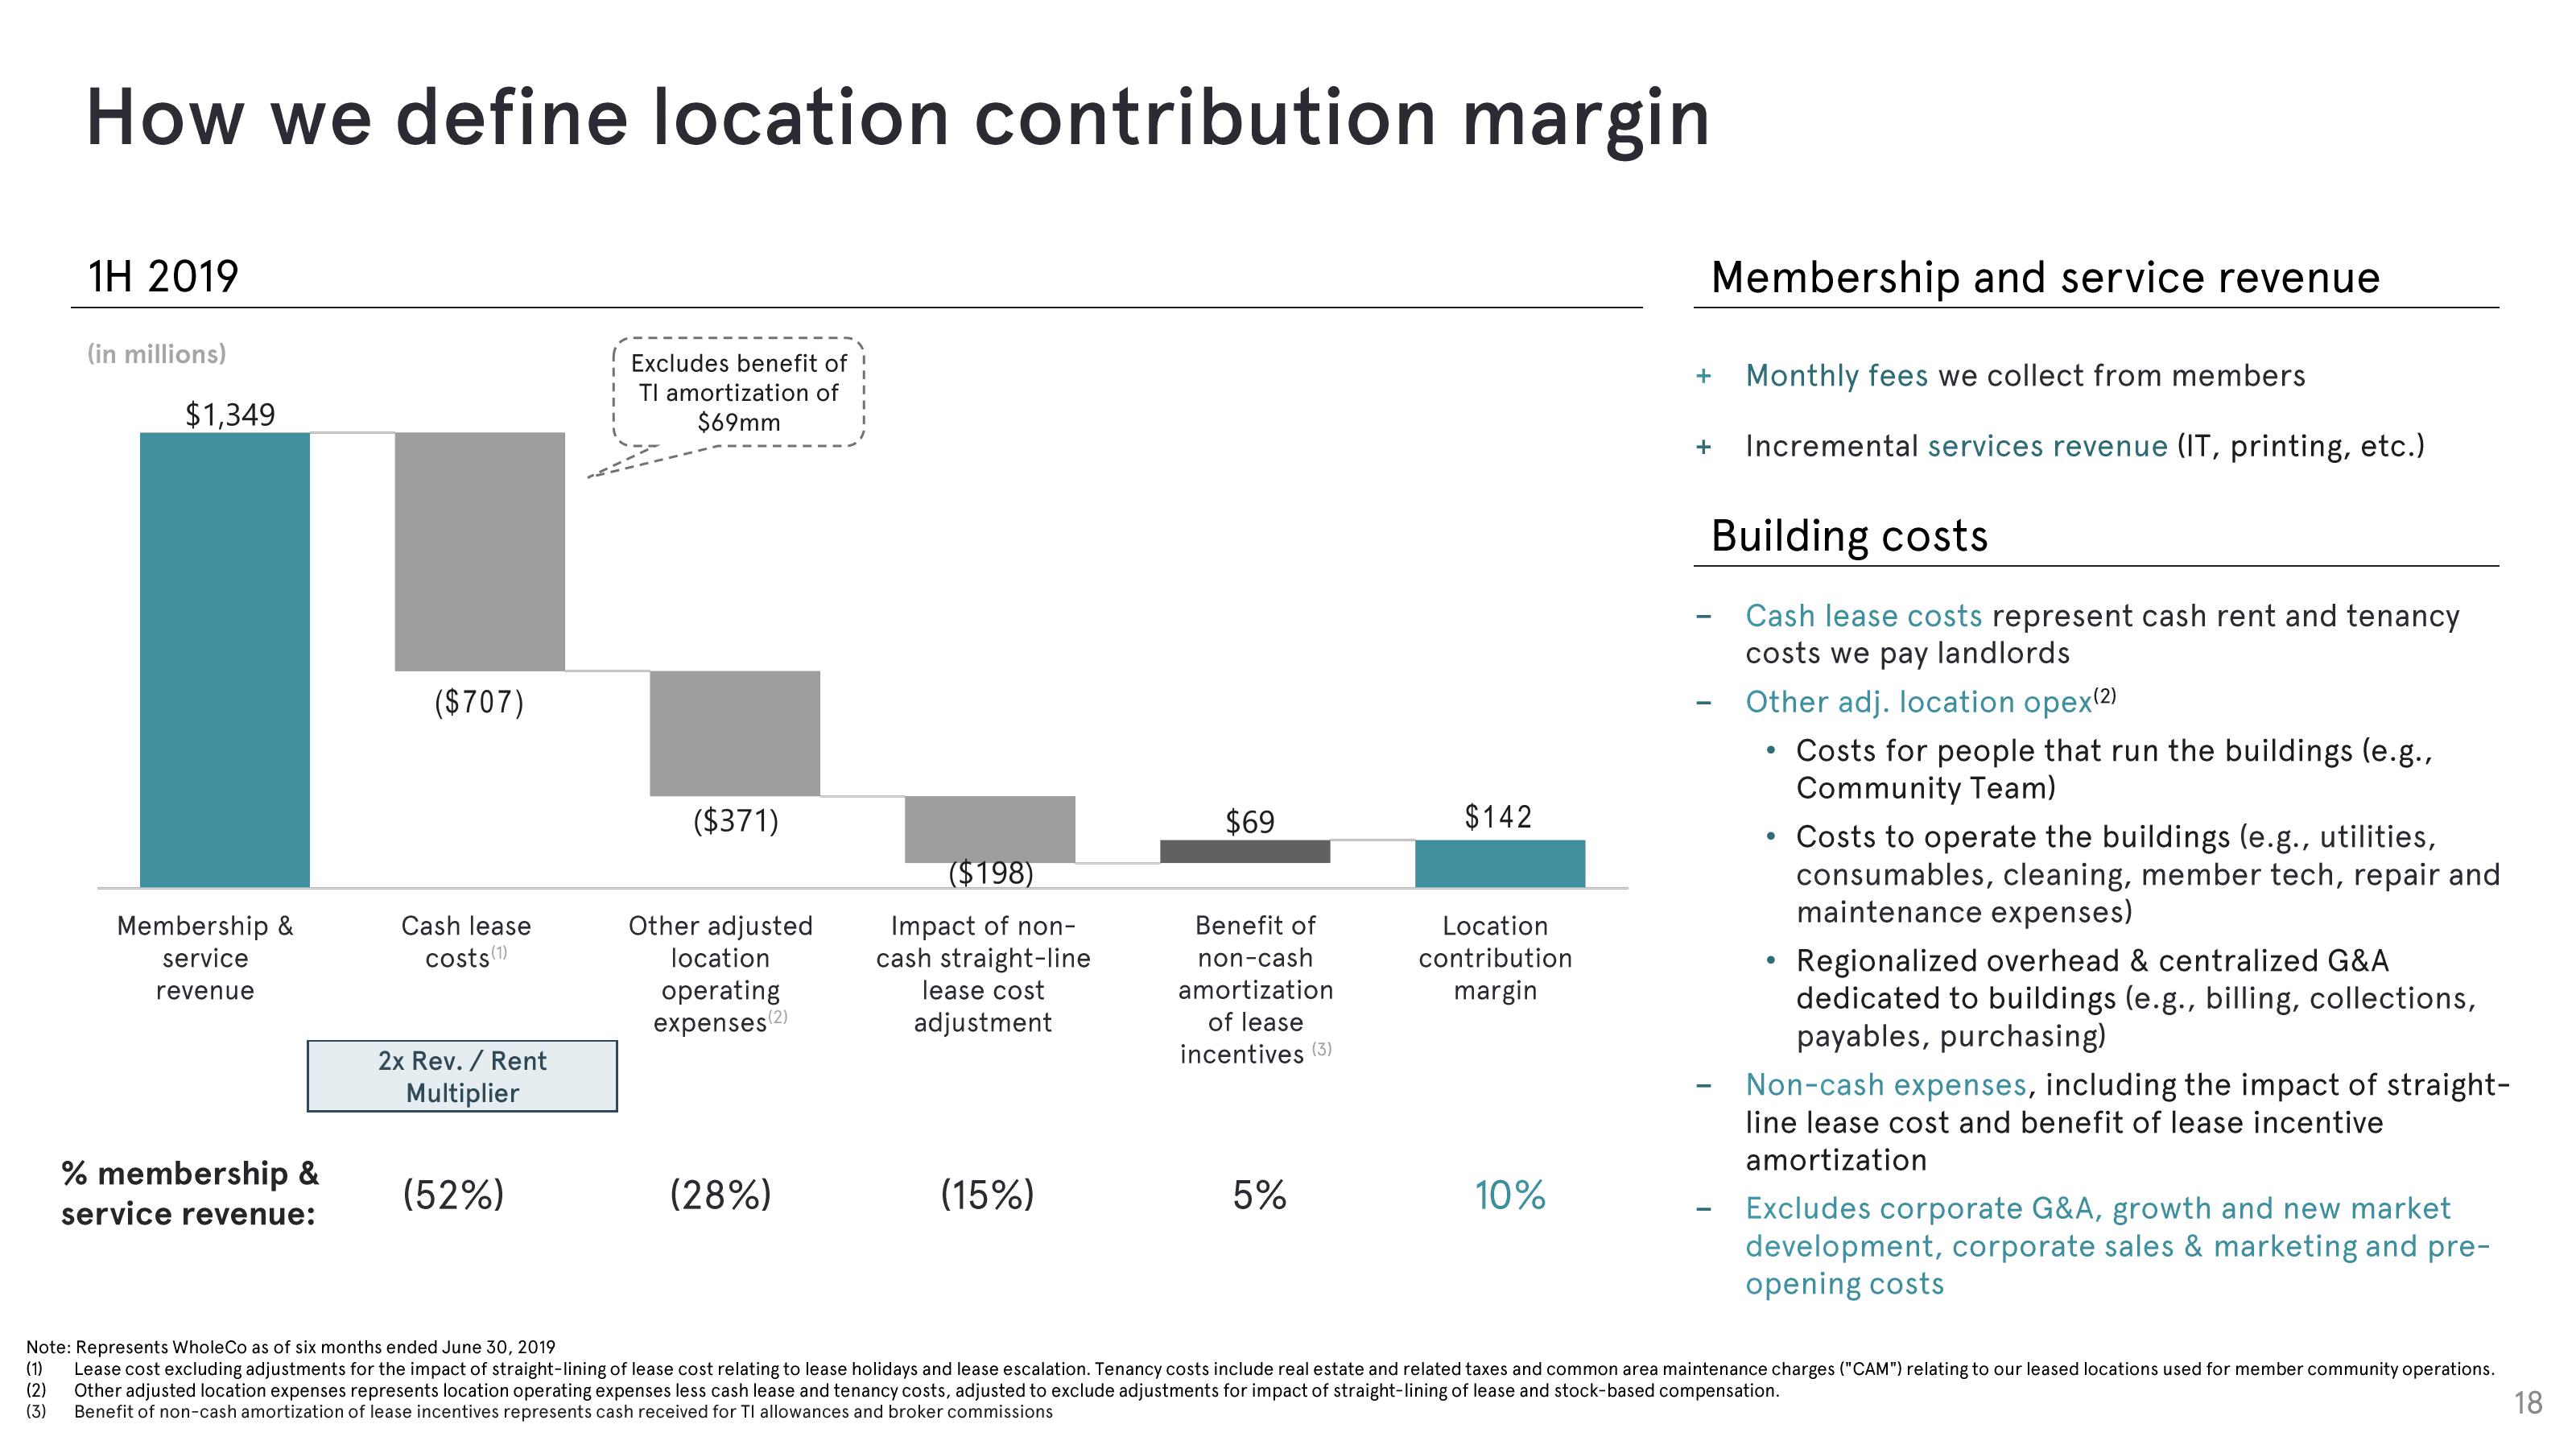
How we define location contribution margin
(1)
(2)
1H 2019
(in millions)
$1,349
Membership &
service
revenue
% membership &
service revenue:
($707)
Cash lease
costs (1)
2x Rev. / Rent
Multiplier
(52%)
Excludes benefit of
Tl amortization of
$69mm
($371)
Other adjusted
location
operating
expenses (2)
(28%)
($198)
Impact of non-
cash straight-line
lease cost
adjustment
(15%)
$69
Benefit of
non-cash
amortization
of lease
incentives (3)
5%
$142
Location
contribution
margin
10%
Membership and service revenue
Monthly fees we collect from members
+ Incremental services revenue (IT, printing, etc.)
+
Building costs
Cash lease costs represent cash rent and tenancy
costs we pay landlords
Other adj. location opex(2)
• Costs for people that run the buildings (e.g.,
Community Team)
• Costs to operate the buildings (e.g., utilities,
consumables, cleaning, member tech, repair and
maintenance expenses)
Regionalized overhead & centralized G&A
dedicated to buildings (e.g., billing, collections,
payables, purchasing)
Non-cash expenses, including the impact of straight-
line lease cost and benefit of lease incentive
amortization
Excludes corporate G&A, growth and new market
development, corporate sales & marketing and pre-
opening costs
Note: Represents WholeCo as of six months ended June 30, 2019
Lease cost excluding adjustments for the impact of straight-lining of lease cost relating to lease holidays and lease escalation. Tenancy costs include real estate and related taxes and common area maintenance charges ("CAM") relating to our leased locations used for member community operations.
Other adjusted location expenses represents location operating expenses less cash lease and tenancy costs, adjusted to exclude adjustments for impact of straight-lining of lease and stock-based compensation.
(3) Benefit of non-cash amortization of lease incentives represents cash received for TI allowances and broker commissions
18View entire presentation