First Foundation Investor Presentation Deck
Earnings Growth While Investing in the Future
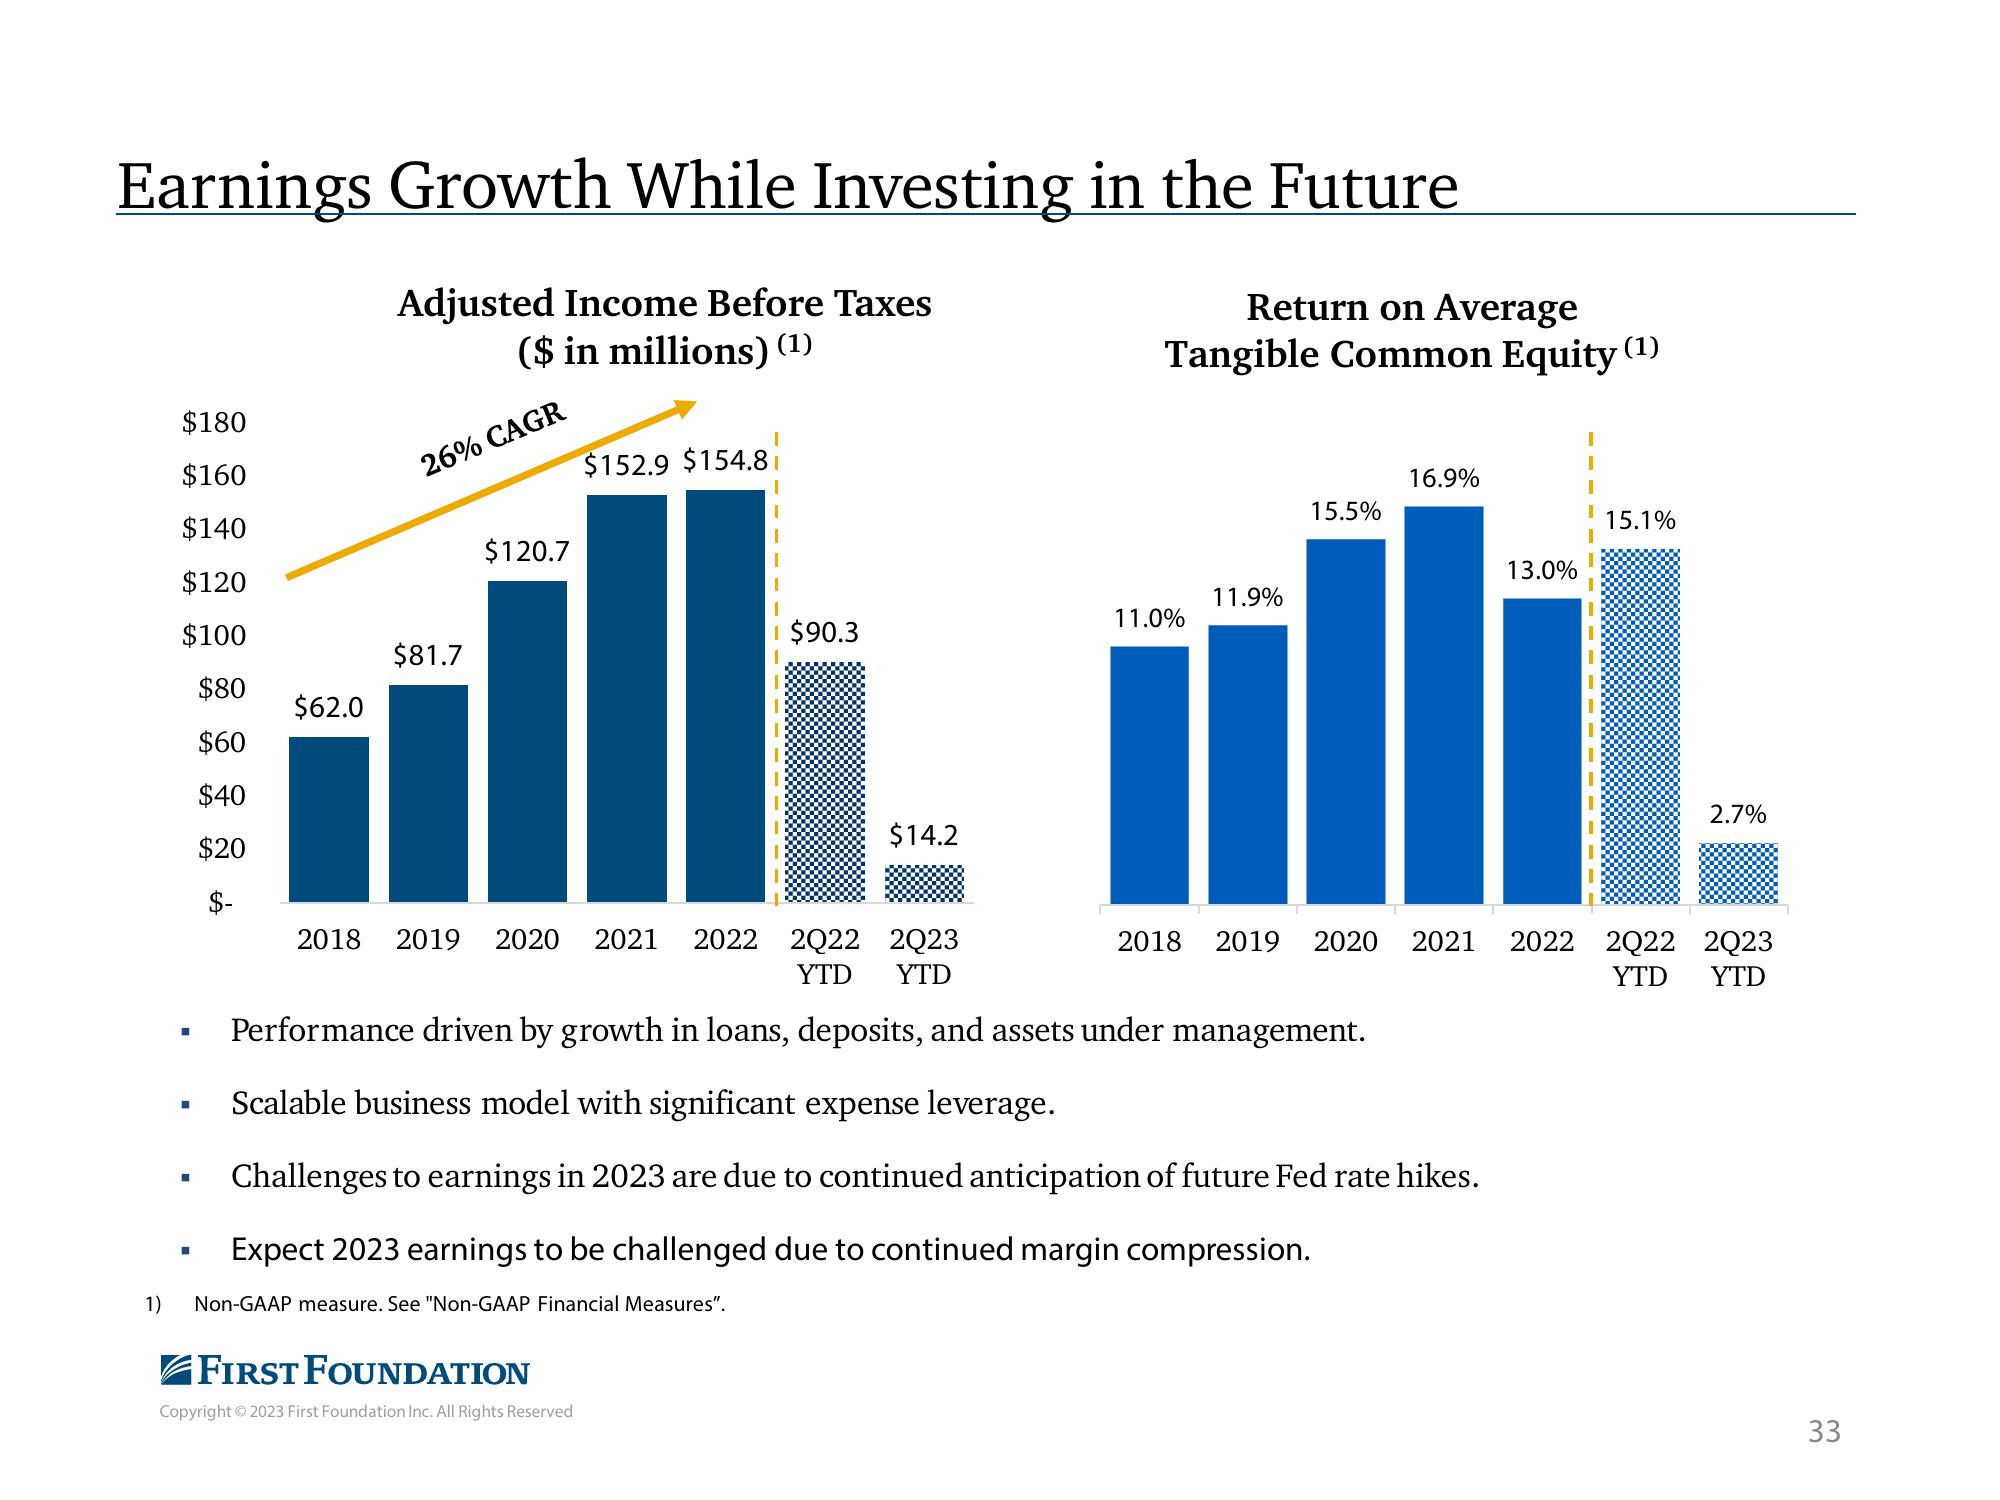
Adjusted Income Before Taxes
($ in millions) (1)
1)
$180
$160
$140
$120
$100
$80
$60
$40
$20
$-
I
■
■
$62.0
26% CAGR
$81.7
$120.7
$152.9 $154.8
Non-GAAP measure. See "Non-GAAP Financial Measures".
FIRST FOUNDATION
Copyright © 2023 First Foundation Inc. All Rights Reserved
$90.3
$14.2
Return on Average
Tangible Common Equity (¹)
11.0%
11.9%
15.5%
2018 2019 2020 2021 2022 2022 2023
YTD YTD
Performance driven by growth in loans, deposits, and assets under management.
Scalable business model with significant expense leverage.
Challenges to earnings in 2023 are due to continued anticipation of future Fed rate hikes.
Expect 2023 earnings to be challenged due to continued margin compression.
16.9%
2018 2019 2020
13.0%
I
I
15.1%
2.7%
2021 2022 2022 2023
YTD YTD
33View entire presentation