Hugo Boss Investor Presentation Deck slide image

Hugo Boss Investor Presentation Deck

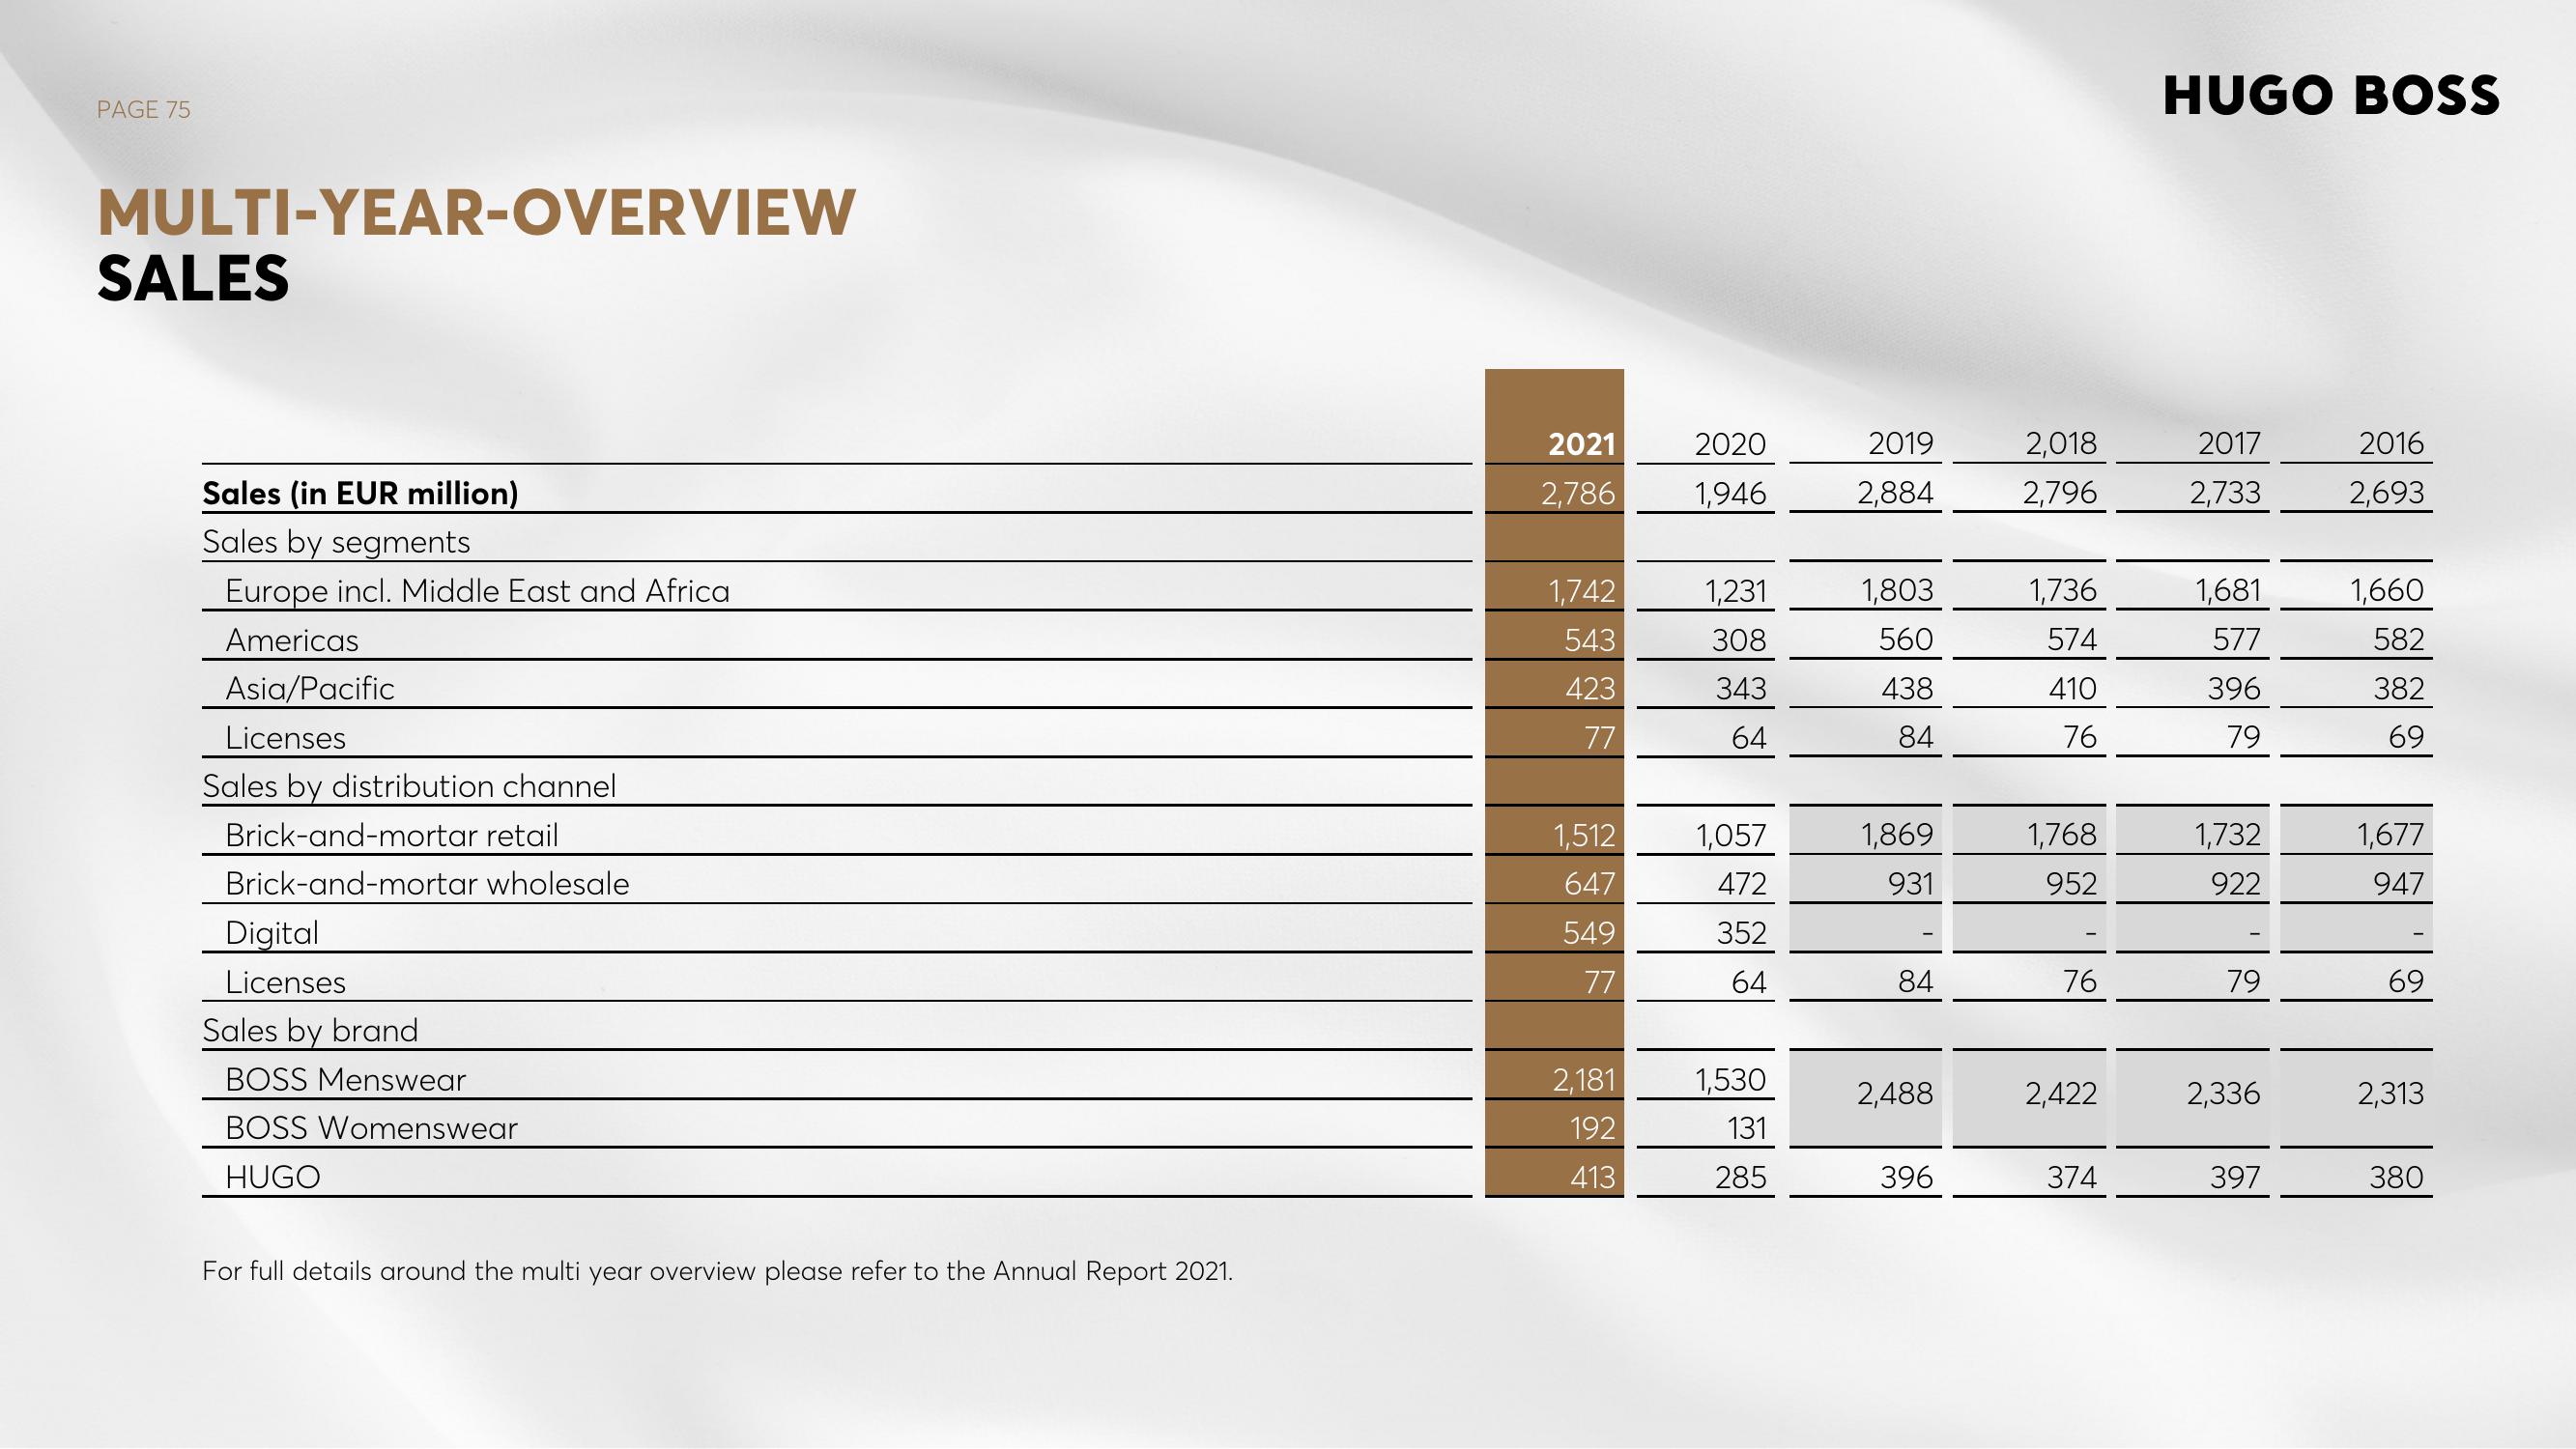
PAGE 75 MULTI-YEAR-OVERVIEW SALES Sales (in EUR million) Sales by segments Europe incl. Middle East and Africa Americas Asia/Pacific Licenses Sales by distribution channel Brick-and-mortar retail Brick-and-mortar wholesale Digital Licenses Sales by brand BOSS Menswear BOSS Womenswear HUGO For full details around the multi year overview please refer to the Annual Report 2021. 2021 2020 2,786 1,946 1,742 543 423 77 1,512 647 549 77 2,181 192 413 1,231 308 343 64 1,057 472 352 64 1,530 131 285 2019 2,884 1,803 560 438 84 1,869 931 84 2,488 396 2,018 2,796 1,736 574 410 76 1,768 952 76 2,422 374 HUGO BOSS 2017 2,733 1,681 577 396 79 1,732 922 79 2,336 397 2016 2,693 1,660 582 382 69 1,677 947 69 2,313 380
View entire presentation