dLocal Results Presentation Deck
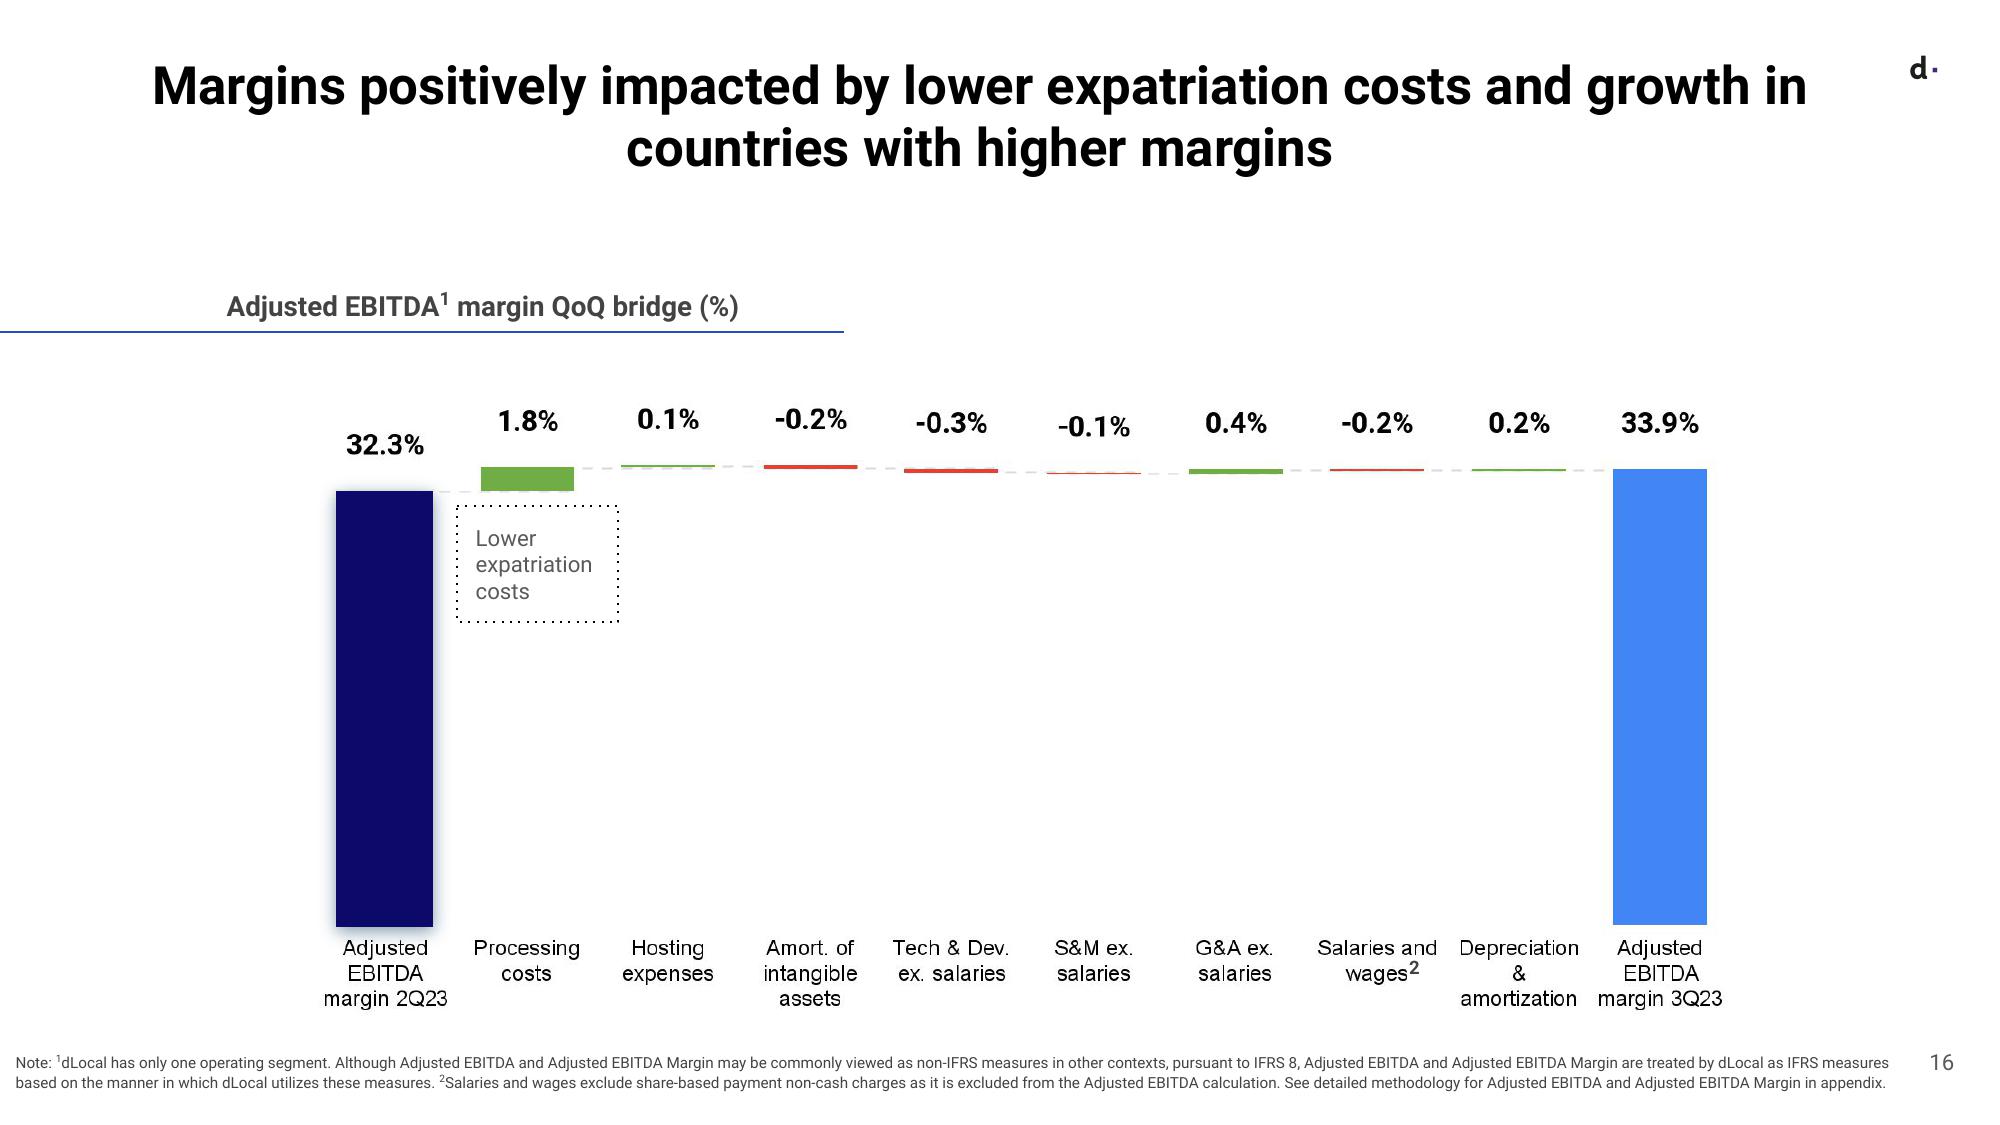
Margins positively impacted by lower expatriation costs and growth in
countries with higher margins
Adjusted EBITDA¹ margin QoQ bridge (%)
32.3%
Adjusted
EBITDA
margin 2Q23
1.8%
Lower
expatriation
costs
0.1%
Processing Hosting
costs
expenses
-0.2%
-0.3%
Amort. of Tech & Dev.
intangible ex. salaries
assets
-0.1%
S&M ex.
salaries
0.4%
G&A ex.
salaries
-0.2%
0.2%
33.9%
Salaries and Depreciation
&
amortization margin 3Q23
wages2
Adjusted
EBITDA
Note: 'dLocal has only one operating segment. Although Adjusted EBITDA and Adjusted EBITDA Margin may be commonly viewed as non-IFRS measures in other contexts, pursuant to IFRS 8, Adjusted EBITDA and Adjusted EBITDA Margin are treated by dLocal as IFRS measures
based on the manner in which dLocal utilizes these measures. ²Salaries and wages exclude share-based payment non-cash charges as it is excluded from the Adjusted EBITDA calculation. See detailed methodology for Adjusted EBITDA and Adjusted EBITDA Margin in appendix.
d.
16View entire presentation