Telia Company Results Presentation Deck
LED MARKETS
795
Lithuania
Reported currency, in millions, like for like growth
+4.0%
●
804
+3.6%
780
788
781
Q1 Q2 Q3 Q4 Q1
20 20 20 20 21
Service revenues
373 375
380
370 368
Q1 Q2 Q3 Q4 Q1
20 20 20 20 21
EBITDA
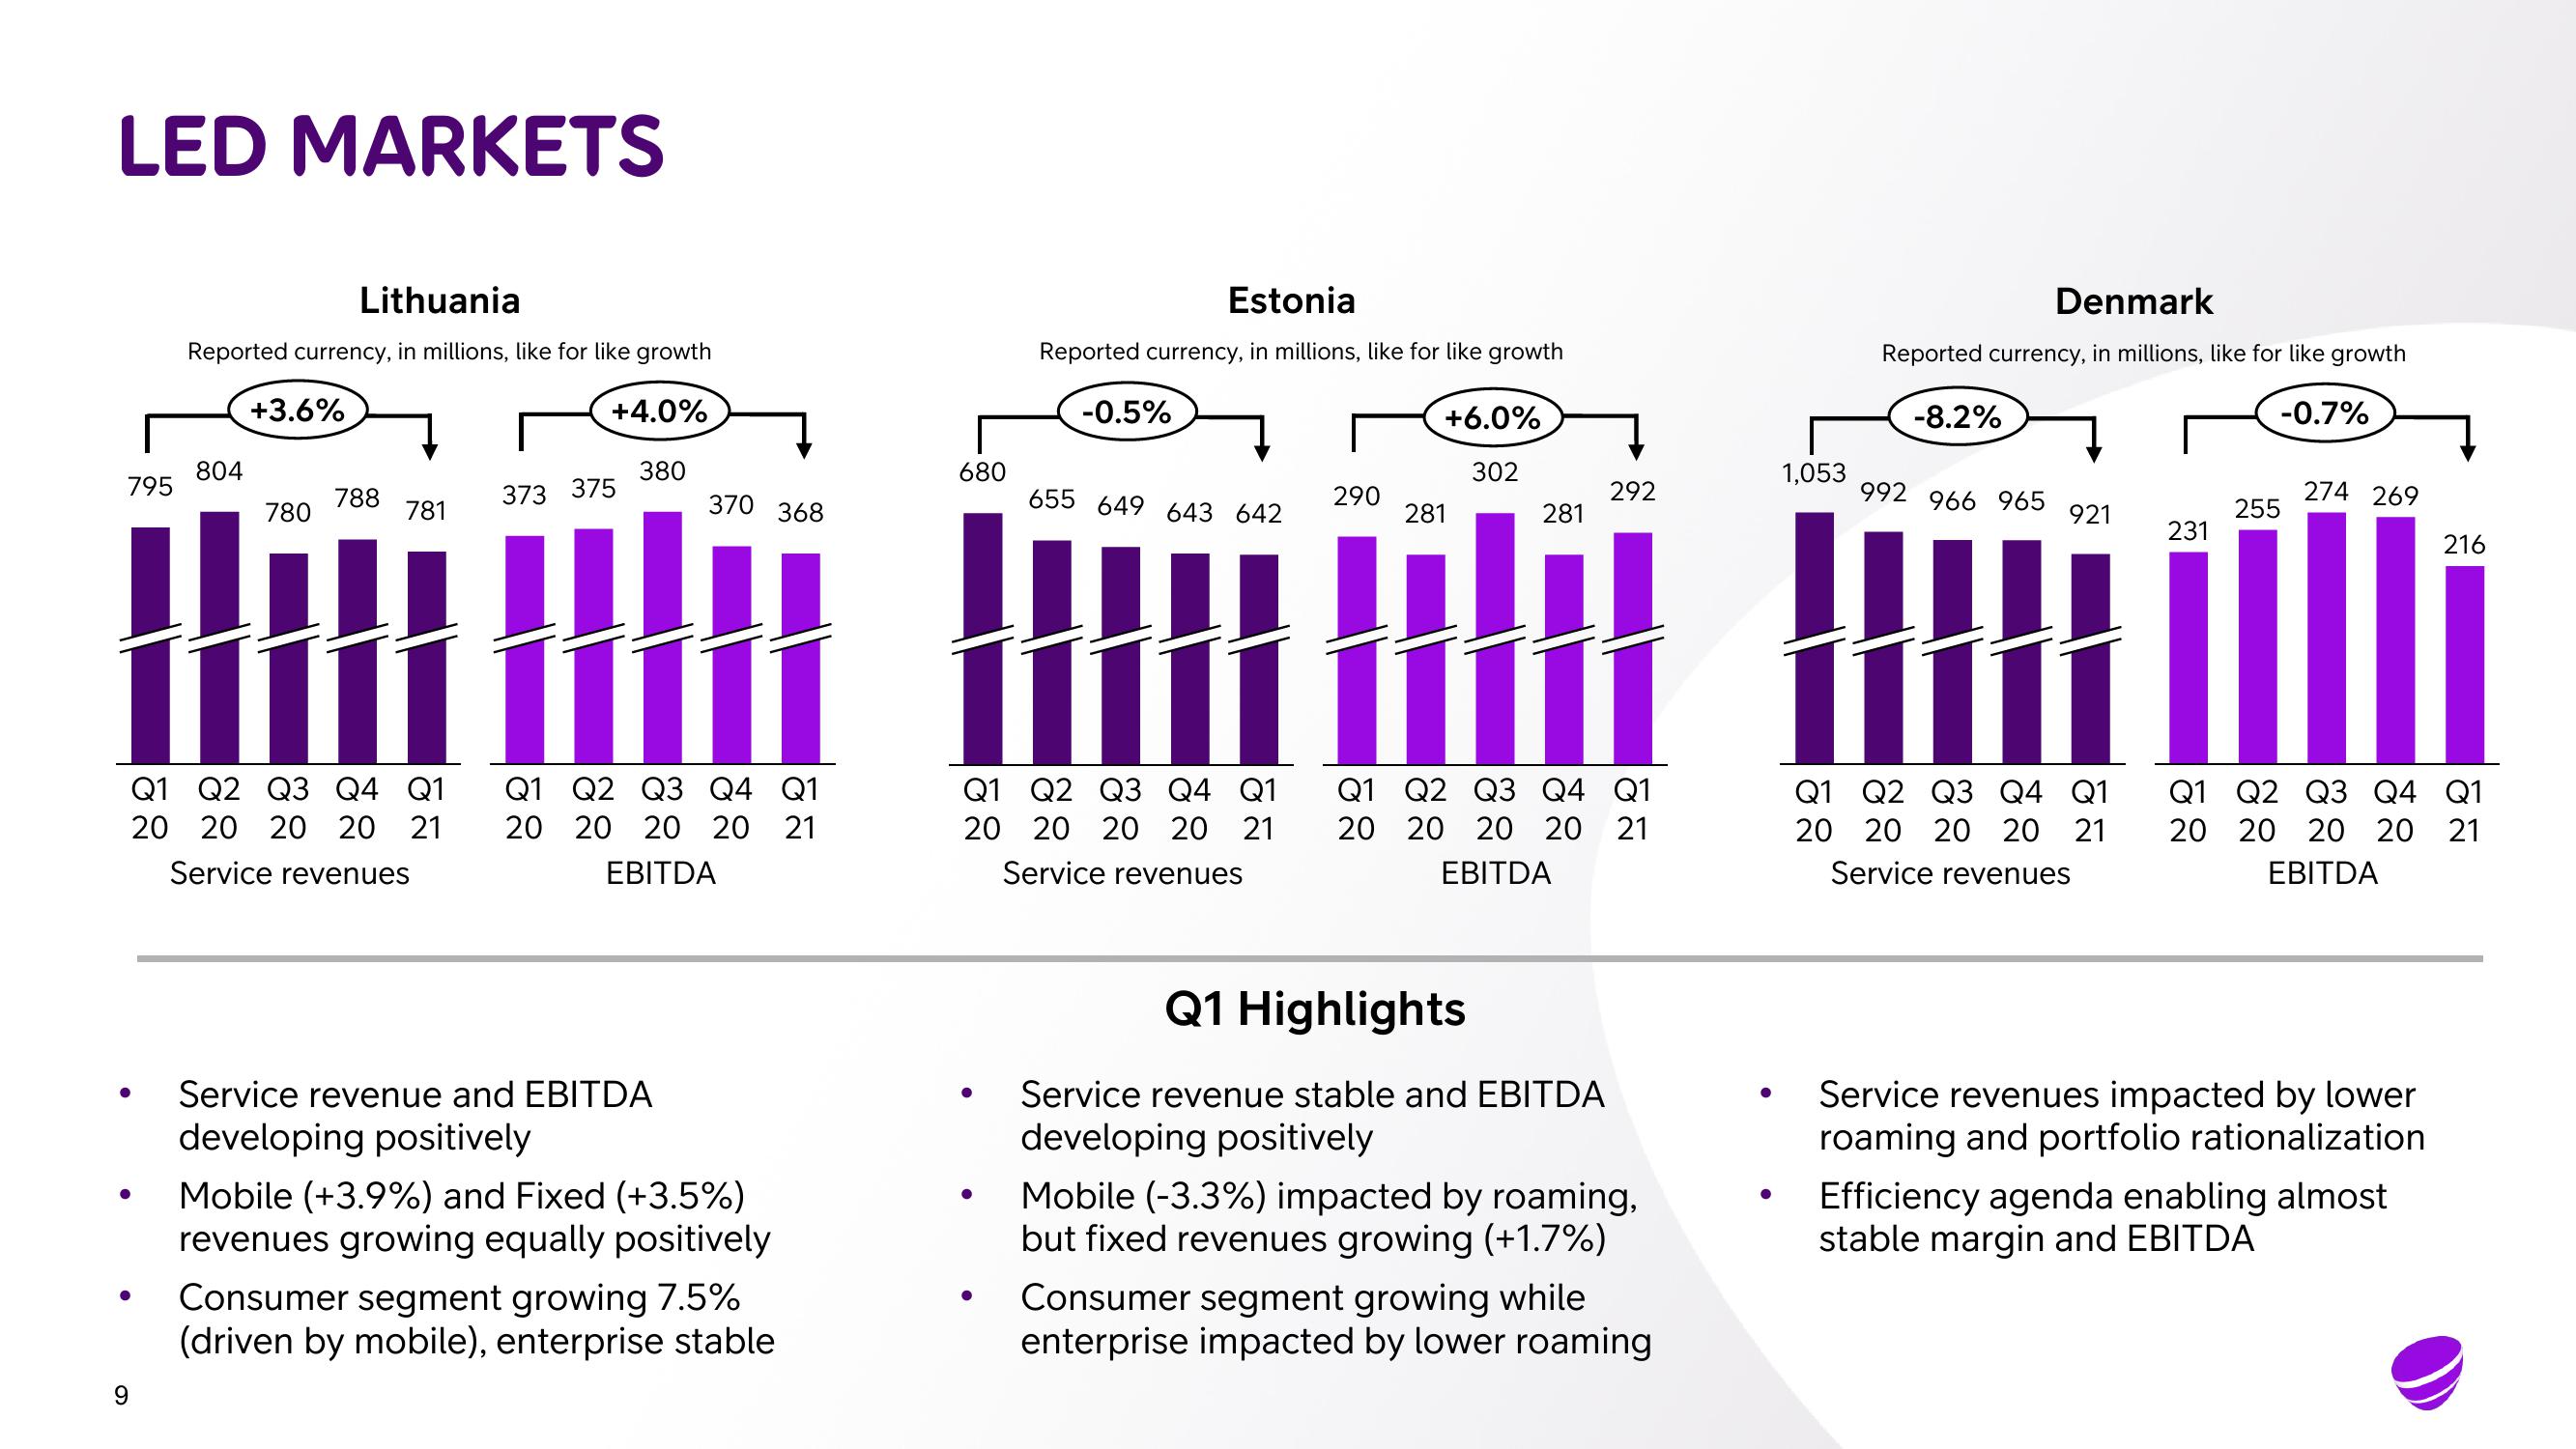
Service revenue and EBITDA
developing positively
Mobile (+3.9%) and Fixed (+3.5%)
revenues growing equally positively
Consumer segment growing 7.5%
(driven by mobile), enterprise stable
680
Estonia
Reported currency, in millions, like for like growth
-0.5%
655 649 643 642
Q1 Q2 Q3 Q4 Q1
20 20 20 20 21
Service revenues
290
+6.0%
302
281
281
Q1 Q2 Q3 Q4
20 20 20 20
EBITDA
Q1 Highlights
Service revenue stable and EBITDA
developing positively
292
Q1
21
Mobile (-3.3%) impacted by roaming,
but fixed revenues growing (+1.7%)
Consumer segment growing while
enterprise impacted by lower roaming
●
1,053
Denmark
Reported currency, in millions, like for like growth
-8.2%
-0.7%
992 966 965
921
Q1 Q2 Q3 Q4 Q1
20 20 20 20 21
Service revenues
231
255
274 269
Q1 Q2 Q3 Q4 Q1
20 20 20 20 21
EBITDA
Service revenues impacted by lower
roaming and portfolio rationalization
216
Efficiency agenda enabling almost
stable margin and EBITDAView entire presentation