Avantor Results Presentation Deck
Q3 adjusted P&L
USD in millions
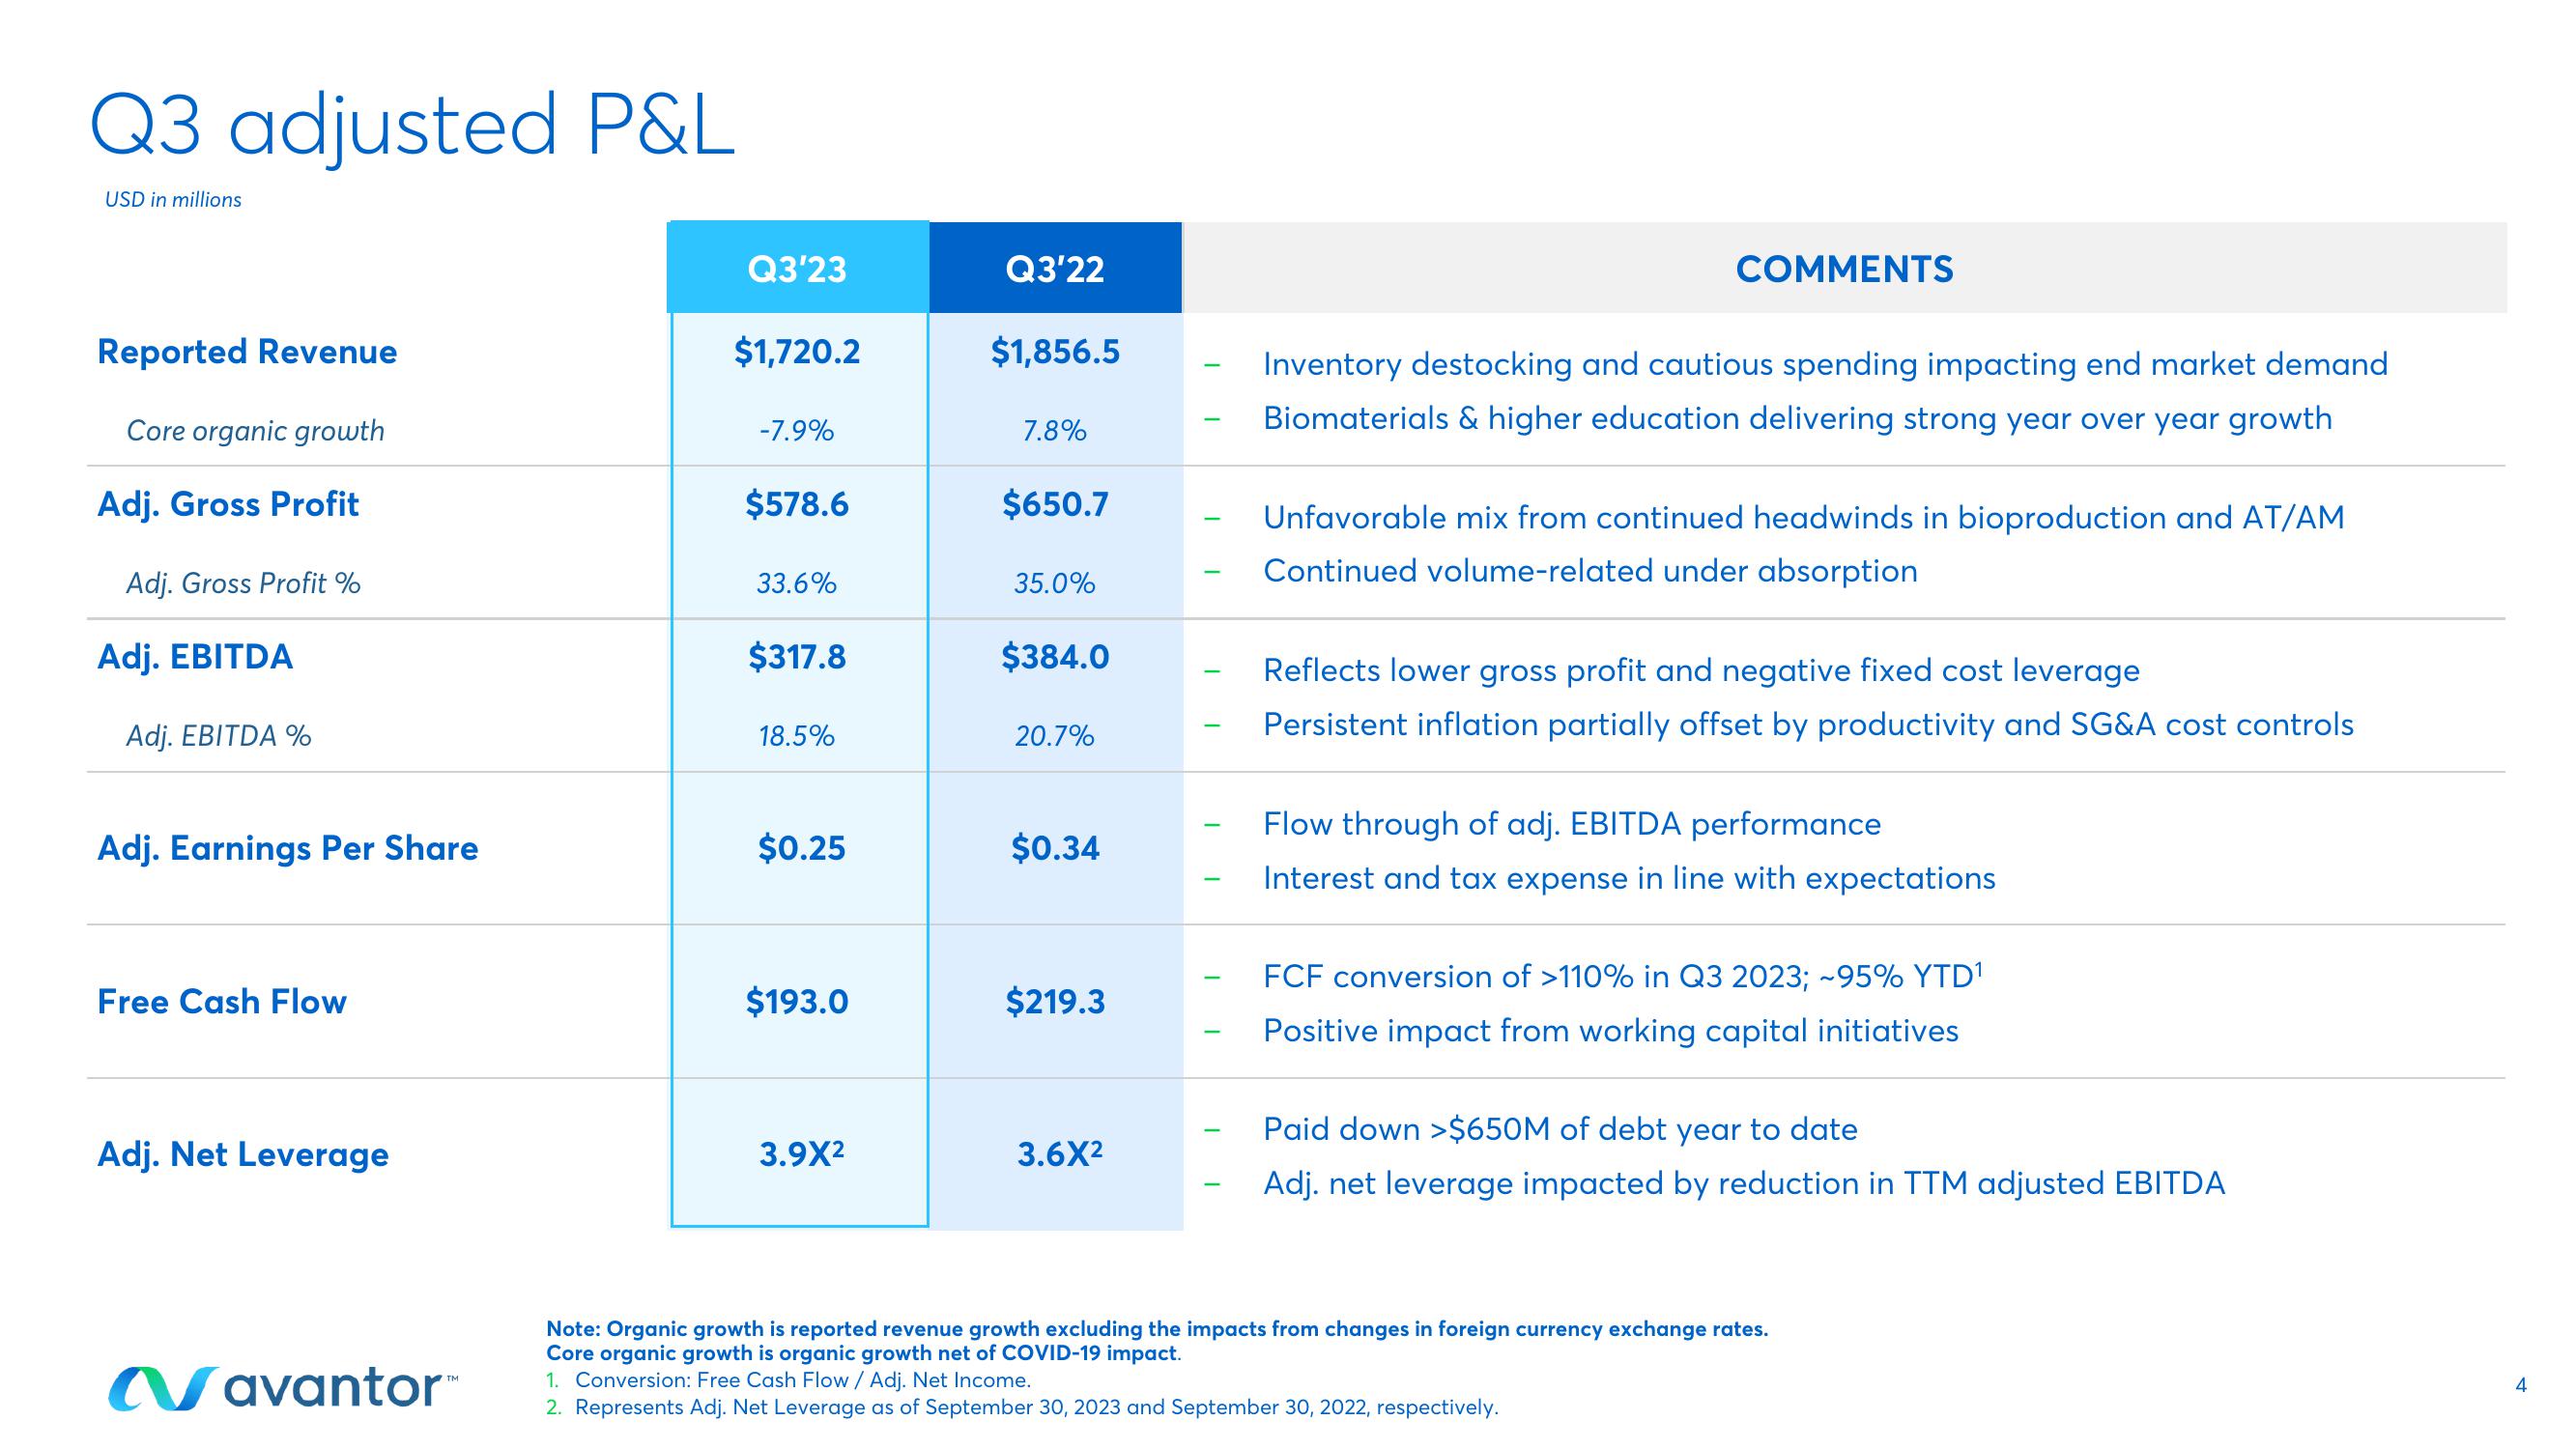
Reported Revenue
Core organic growth
Adj. Gross Profit
Adj. Gross Profit %
Adj. EBITDA
Adj. EBITDA %
Adj. Earnings Per Share
Free Cash Flow
Adj. Net Leverage
Navantor™
Q3'23
$1,720.2
-7.9%
$578.6
33.6%
$317.8
18.5%
$0.25
$193.0
3.9X²
Q3'22
$1,856.5
7.8%
$650.7
35.0%
$384.0
20.7%
$0.34
$219.3
3.6X²
-
-
-
-
-
COMMENTS
Inventory destocking and cautious spending impacting end market demand
Biomaterials & higher education delivering strong year over year growth
Unfavorable mix from continued headwinds in bioproduction and AT/AM
Continued volume-related under absorption
Reflects lower gross profit and negative fixed cost leverage
Persistent inflation partially offset by productivity and SG&A cost controls
Flow through of adj. EBITDA performance
Interest and tax expense in line with expectations
FCF conversion of >110% in Q3 2023; -95% YTD¹
Positive impact from working capital initiatives
Paid down >$650M of debt year to date
Adj. net leverage impacted by reduction in TTM adjusted EBITDA
Note: Organic growth is reported revenue growth excluding the impacts from changes in foreign currency exchange rates.
Core organic growth is organic growth net of COVID-19 impact.
1. Conversion: Free Cash Flow / Adj. Net Income.
2. Represents Adj. Net Leverage as of September 30, 2023 and September 30, 2022, respectively.
4View entire presentation