AstraZeneca Results Presentation Deck
Reported profit and loss
Total revenue
- product sales
- collaboration revenue
Gross margin
Operating expenses¹
- R&D² expenses
- SG&A³ expenses
Other operating income
Operating profit
Tax rate
EPS
H1 2021
$m
15,540
15,302
238
73.5%
9,771
3,542
6,027
1,308
3,022
11.0%
$1.61
change
%
18
19
(12)
(6.1) pp4
12
22
7
116
25
45
% total
revenue
100
98
2
63
23
39
8
19
Q2 2021
$m
8,220
8,045
175
72.8%
5,030
1,829
3,098
128
1,127
28.0%
$0.42
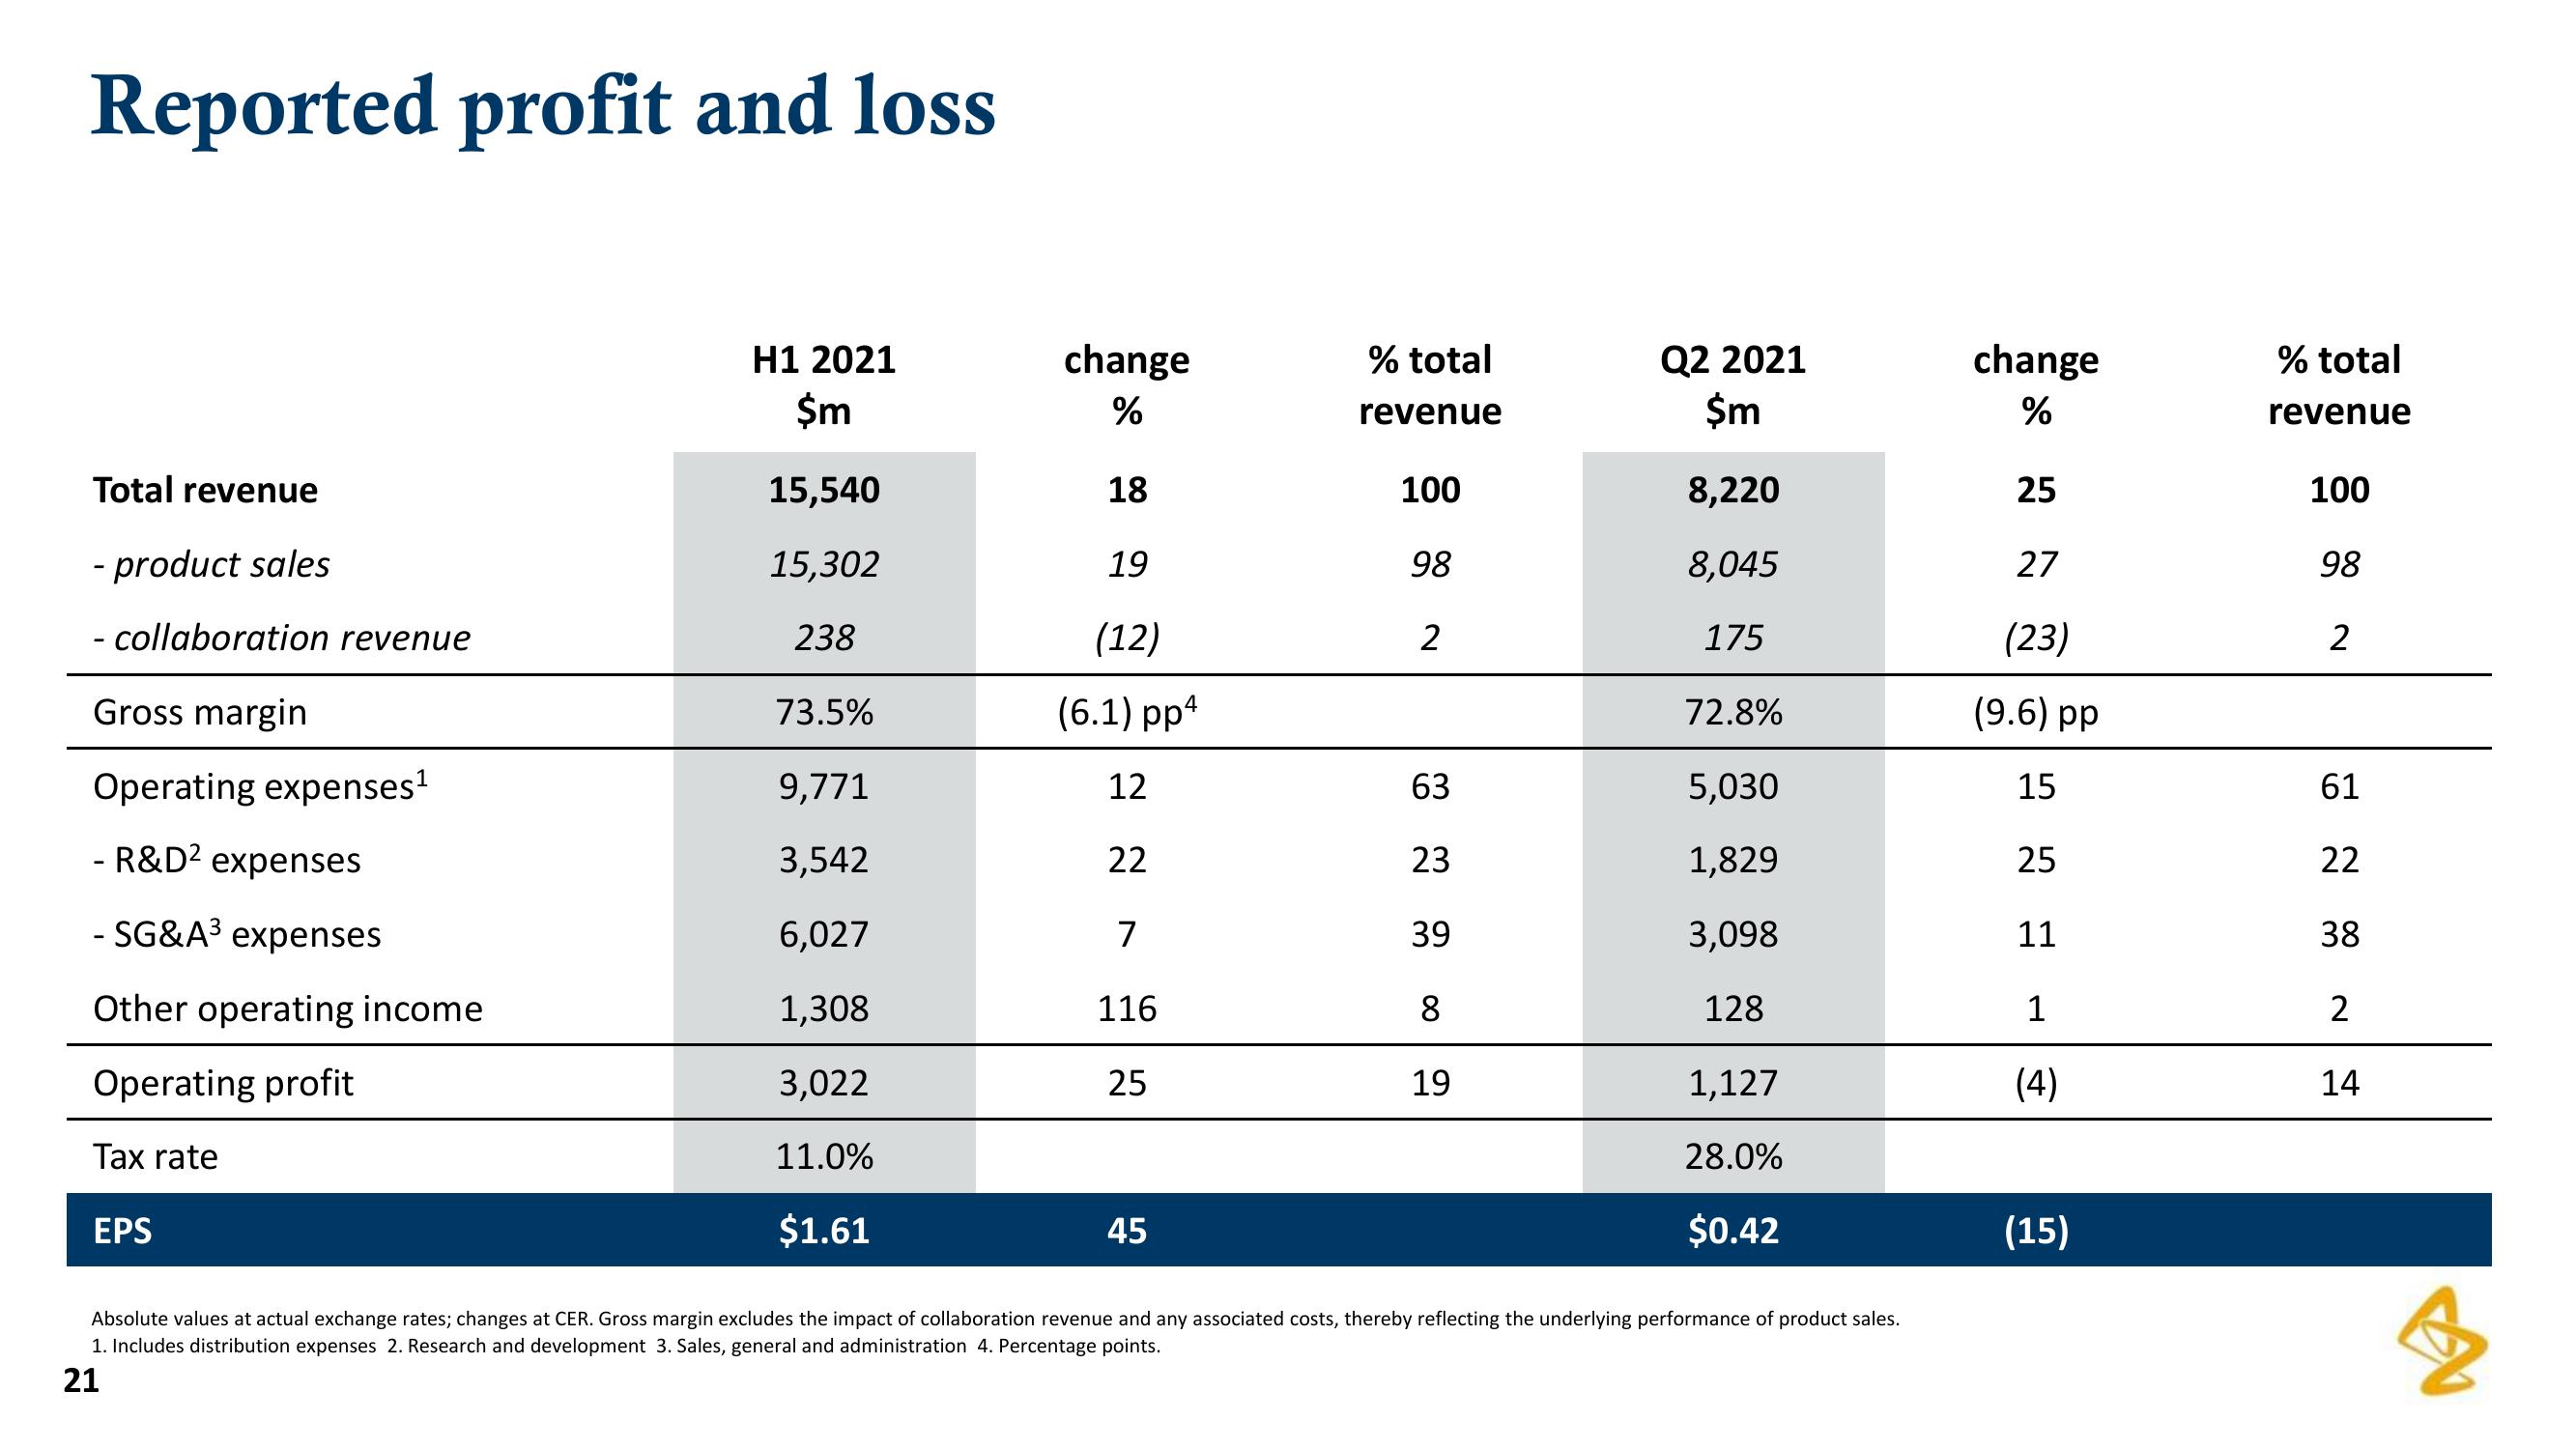
Absolute values at actual exchange rates; changes at CER. Gross margin excludes the impact of collaboration revenue and any associated costs, thereby reflecting the underlying performance of product sales.
1. Includes distribution expenses 2. Research and development 3. Sales, general and administration 4. Percentage points.
21
change
%
25
27
(23)
(9.6) pp
15
25
11
1
(4)
(15)
% total
revenue
100
98
2
61
22
38
2
14
3View entire presentation