SoftBank Results Presentation Deck
SVF1
SVF2
PROGRESS & HIGHLIGHTS
FV
BY SECTOR ¹
LATAM
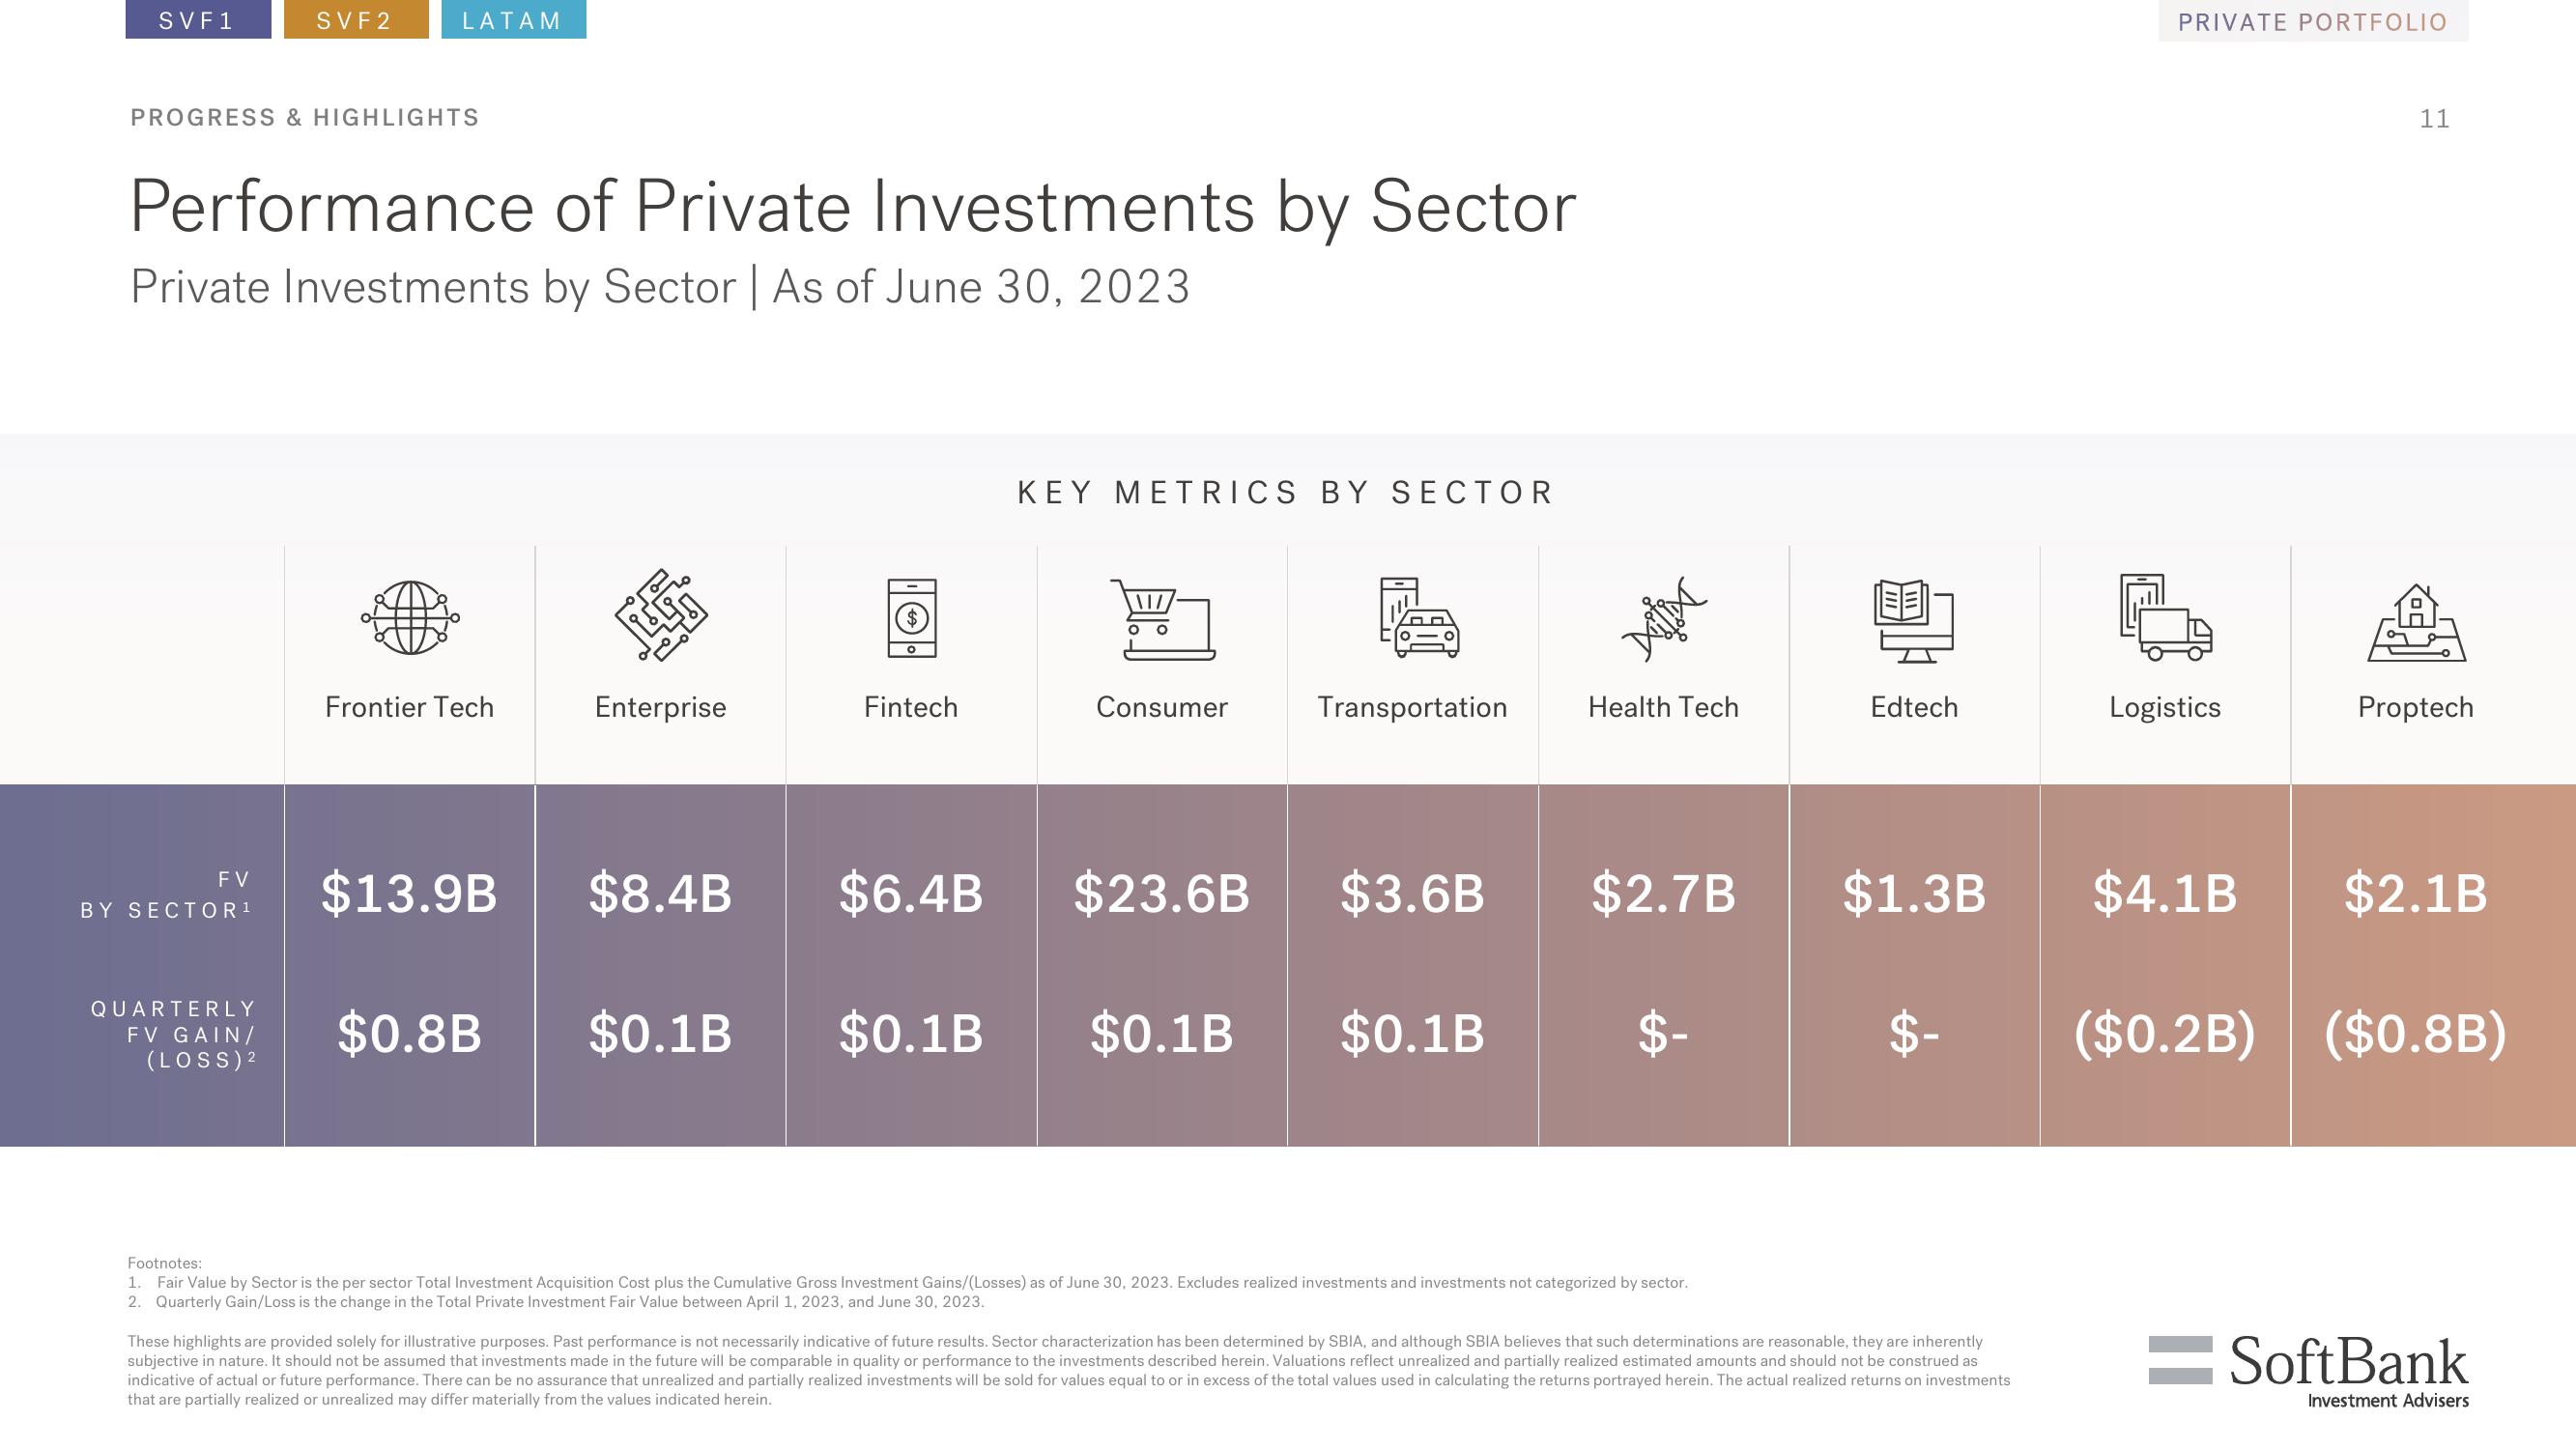
Performance of Private Investments by Sector
Private Investments by Sector | As of June 30, 2023
QUARTERLY
FV GAIN/
(LOSS) ²
Frontier Tech
$13.9B
$0.8B
Lug
Enterprise
$8.4B
$0.1B
Fintech
$6.48
$0.1B
KEY METRICS BY SECTOR
O
Consumer
$23.6B
$0.1B
Transportation
Diji
$0.1B
Health Tech
$3.6B $2.7B
Footnotes:
1. Fair Value by Sector is the per sector Total Investment Acquisition Cost plus the Cumulative Gross Investment Gains/(Losses) as of June 30, 2023. Excludes realized investments and investments not categorized by sector.
2. Quarterly Gain/Loss is the change in the Total Private Investment Fair Value between April 1, 2023, and June 30, 2023.
Edtech
$1.3B
$-
These highlights are provided solely for illustrative purposes. Past performance is not necessarily indicative of future results. Sector characterization has been determined by SBIA, and although SBIA believes that such determinations are reasonable, they are inherently
subjective in nature. It should not be assumed that investments made in the future will be comparable in quality or performance to the investments described herein. Valuations reflect unrealized and partially realized estimated amounts and should not be construed as
indicative of actual or future performance. There can be no assurance that unrealized and partially realized investments will be sold for values equal to or in excess of the total values used in calculating the returns portrayed herein. The actual realized returns on investments
that are partially realized or unrealized may differ materially from the values indicated herein.
PRIVATE PORTFOLIO
Logistics
11
Proptech
$4.1B $2.1B
($0.2B) ($0.8B)
=SoftBank
Investment AdvisersView entire presentation