Reservoir Investor Presentation Deck
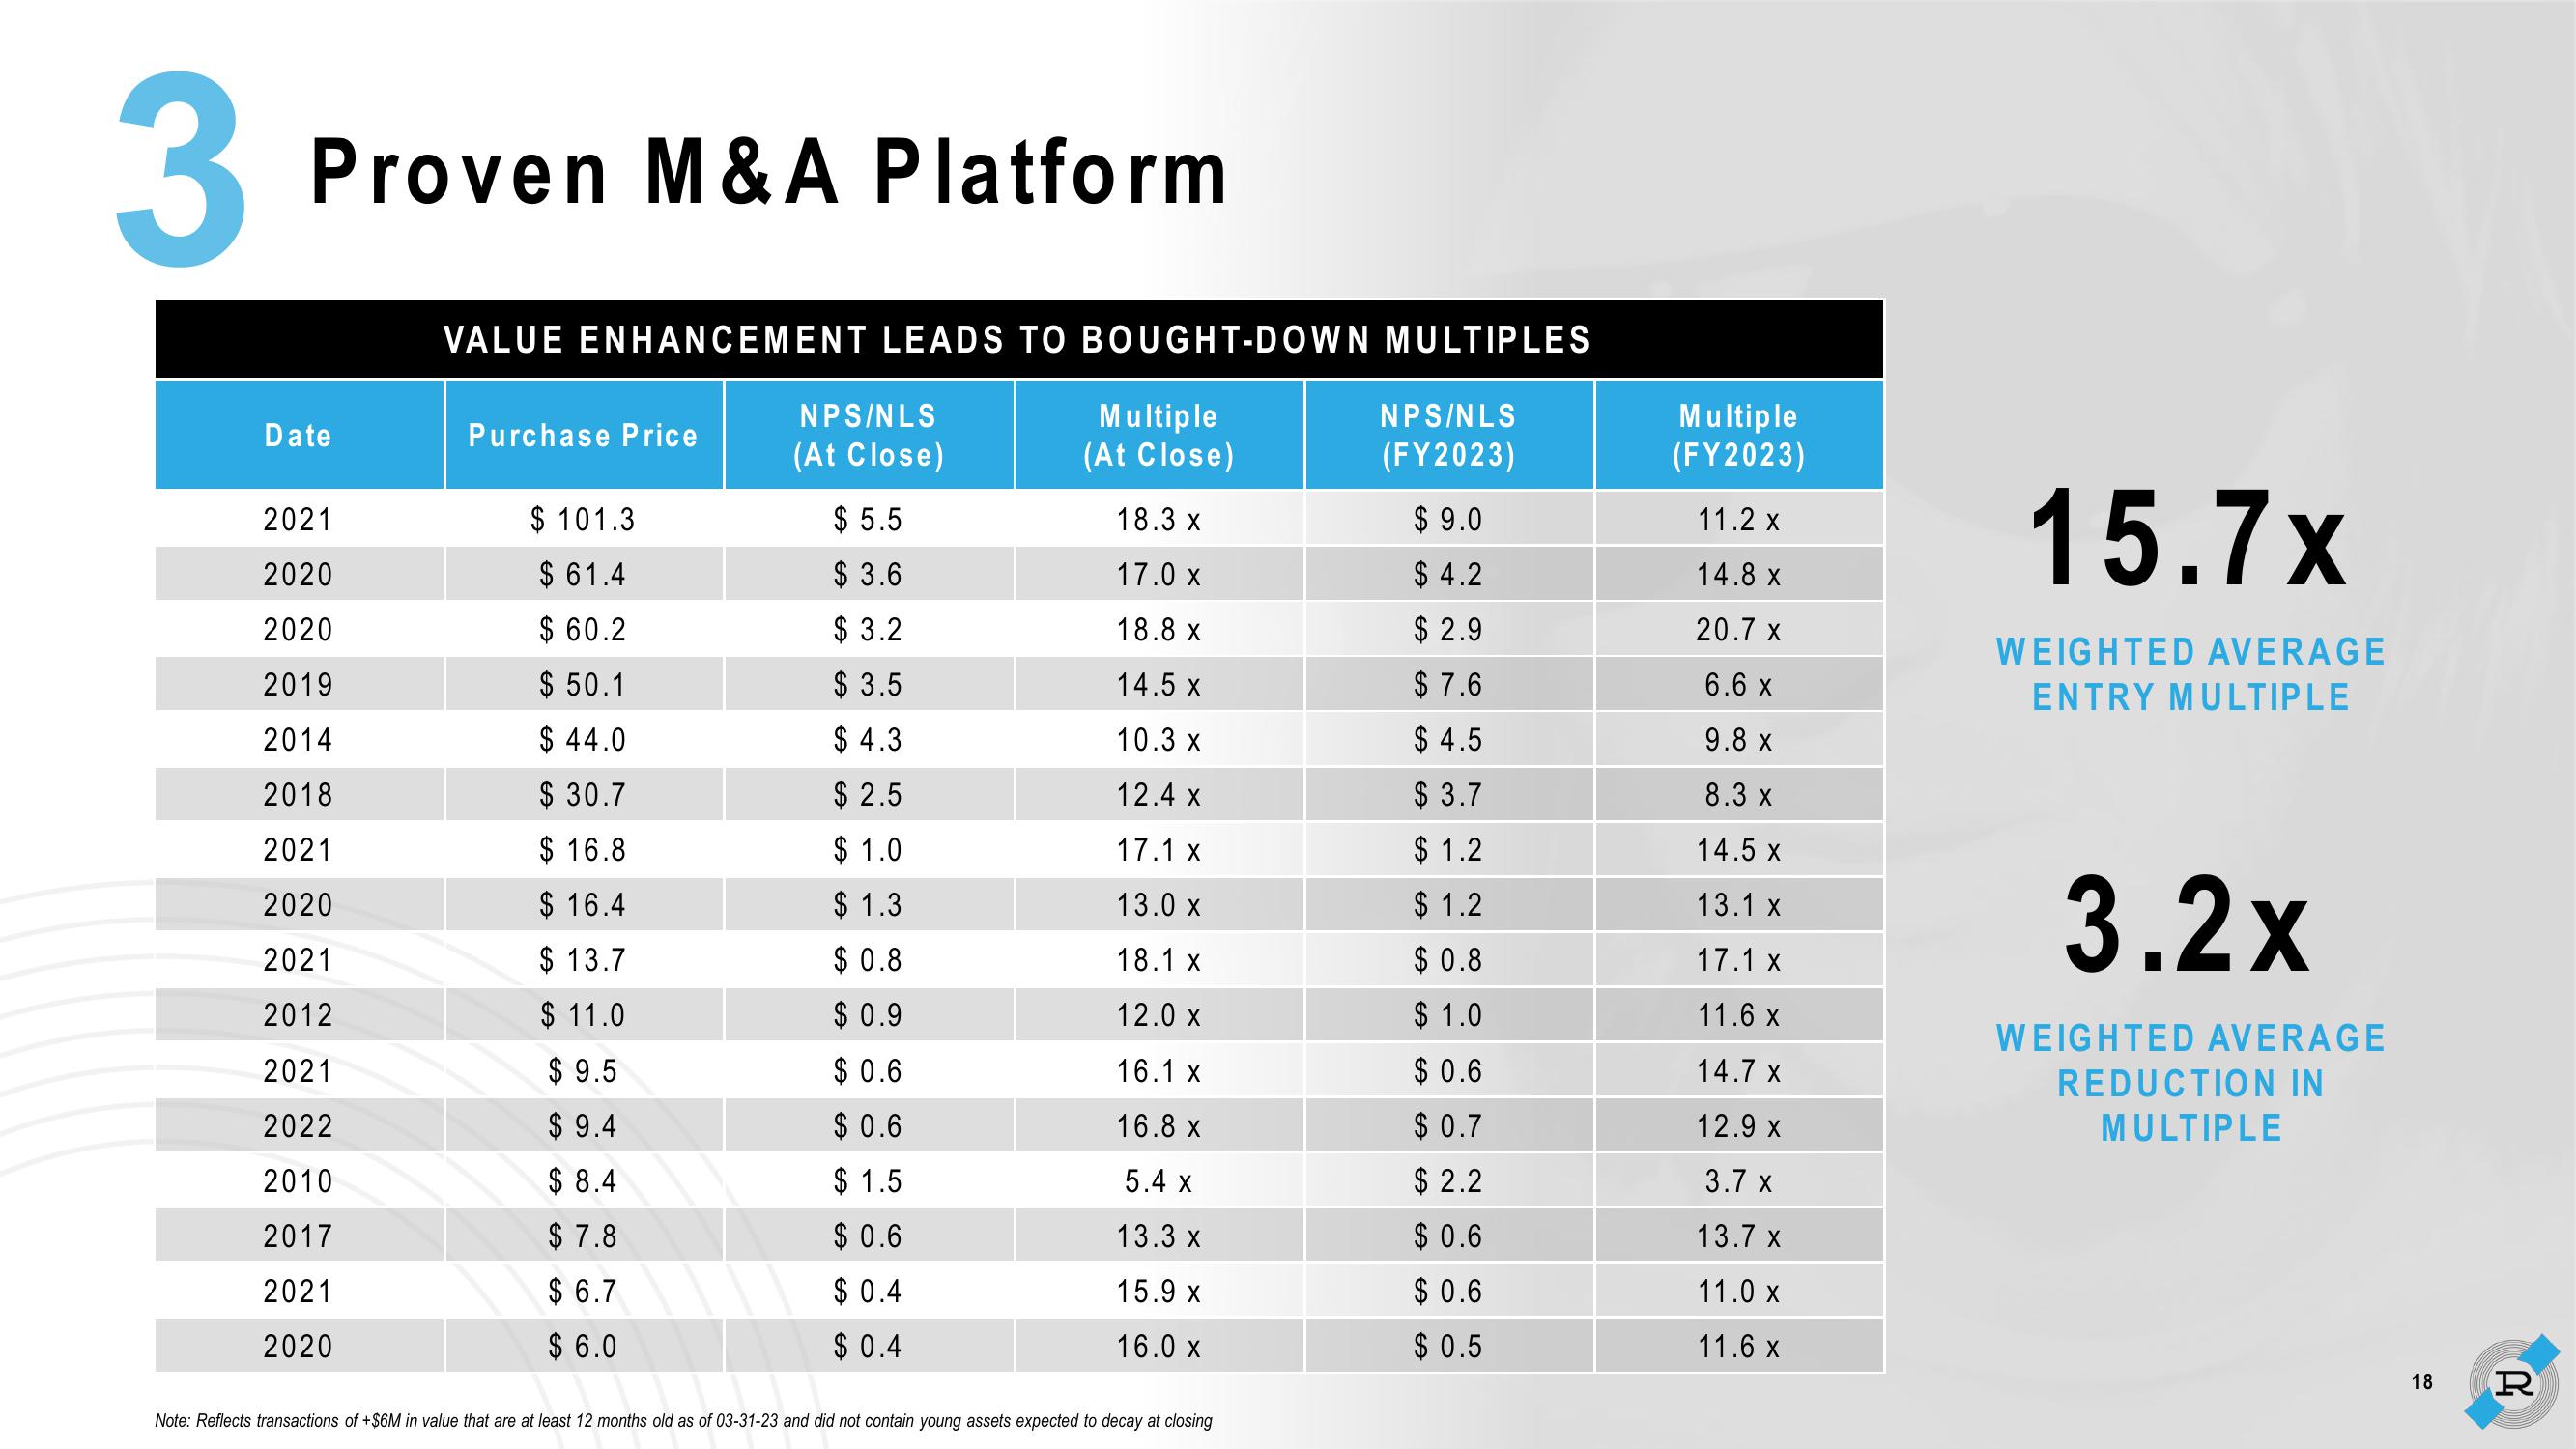
3 Proven M&A Platform
Date
2021
2020
2020
2019
2014
2018
2021
2020
2021
2012
2021
2022
2010
2017
2021
2020
VALUE ENHANCEMENT LEADS TO BOUGHT-DOWN MULTIPLES
Purchase Price
$ 101.3
$61.4
$ 60.2
$50.1
$44.0
$ 30.7
$16.8
$ 16.4
$13.7
$11.0
$9.5
$9.4
$8.4
$7.8
$6.7
$6.0
NPS/NLS
(At Close)
$5.5
$3.6
$3.2
$3.5
$4.3
$2.5
$1.0
$1.3
$0.8
$0.9
$ 0.6
$ 0.6
$1.5
$0.6
$0.4
$0.4
Multiple
(At Close)
18.3 x
17.0 x
18.8 x
14.5 x
10.3 x
12.4 x
17.1 x
13.0 x
18.1 x
12.0 x
16.1 x
16.8 x
5.4 X
13.3 x
15.9 x
16.0 x
Note: Reflects transactions of +$6M in value that are at least 12 months old as of 03-31-23 and did not contain young assets expected to decay at closing
NPS/NLS
(FY2023)
$9.0
$4.2
$2.9
$7.6
$4.5
$ 3.7
$1.2
$1.2
$0.8
$1.0
$ 0.6
$0.7
$2.2
$0.6
$0.6
$0.5
Multiple
(FY2023)
11.2 x
14.8 x
20.7 x
6.6 X
9.8 x
8.3 x
14.5 x
13.1 x
17.1 x
11.6 x
14.7 x
12.9 x
3.7 X
13.7 x
11.0 x
11.6 x
15.7x
WEIGHTED AVERAGE
ENTRY MULTIPLE
3.2x
WEIGHTED AVERAGE
REDUCTION IN
MULTIPLE
18 RView entire presentation