Comcast Results Presentation Deck
NBCUniversal 4th Quarter 2022 Overview
Revenue
y/y%
Adj. EBITDA
y/y%
Revenue
$9,338
7
4Q21
Adjusted EBITDA
$1,282
4Q21
+5.9%
$9,892
4Q22
($M)
4Q22
($M)
(36.3%);
(22.1%) ex.
severance*
$817
($M)
Media
Studios
Theme Parks
$5,979
+2.6%
$2,737
+13.1%
$2,114
+12.0%
*Reported results for 4Q22 include increased severance costs. Refer to Notes page for further details.
All percentages represent year/year growth rates. NM = comparison not meaningful.
See Notes on Slide 12
$132
(81.7%)
$160
NM
$782
+16.0%
Commentary
●
●
●
●
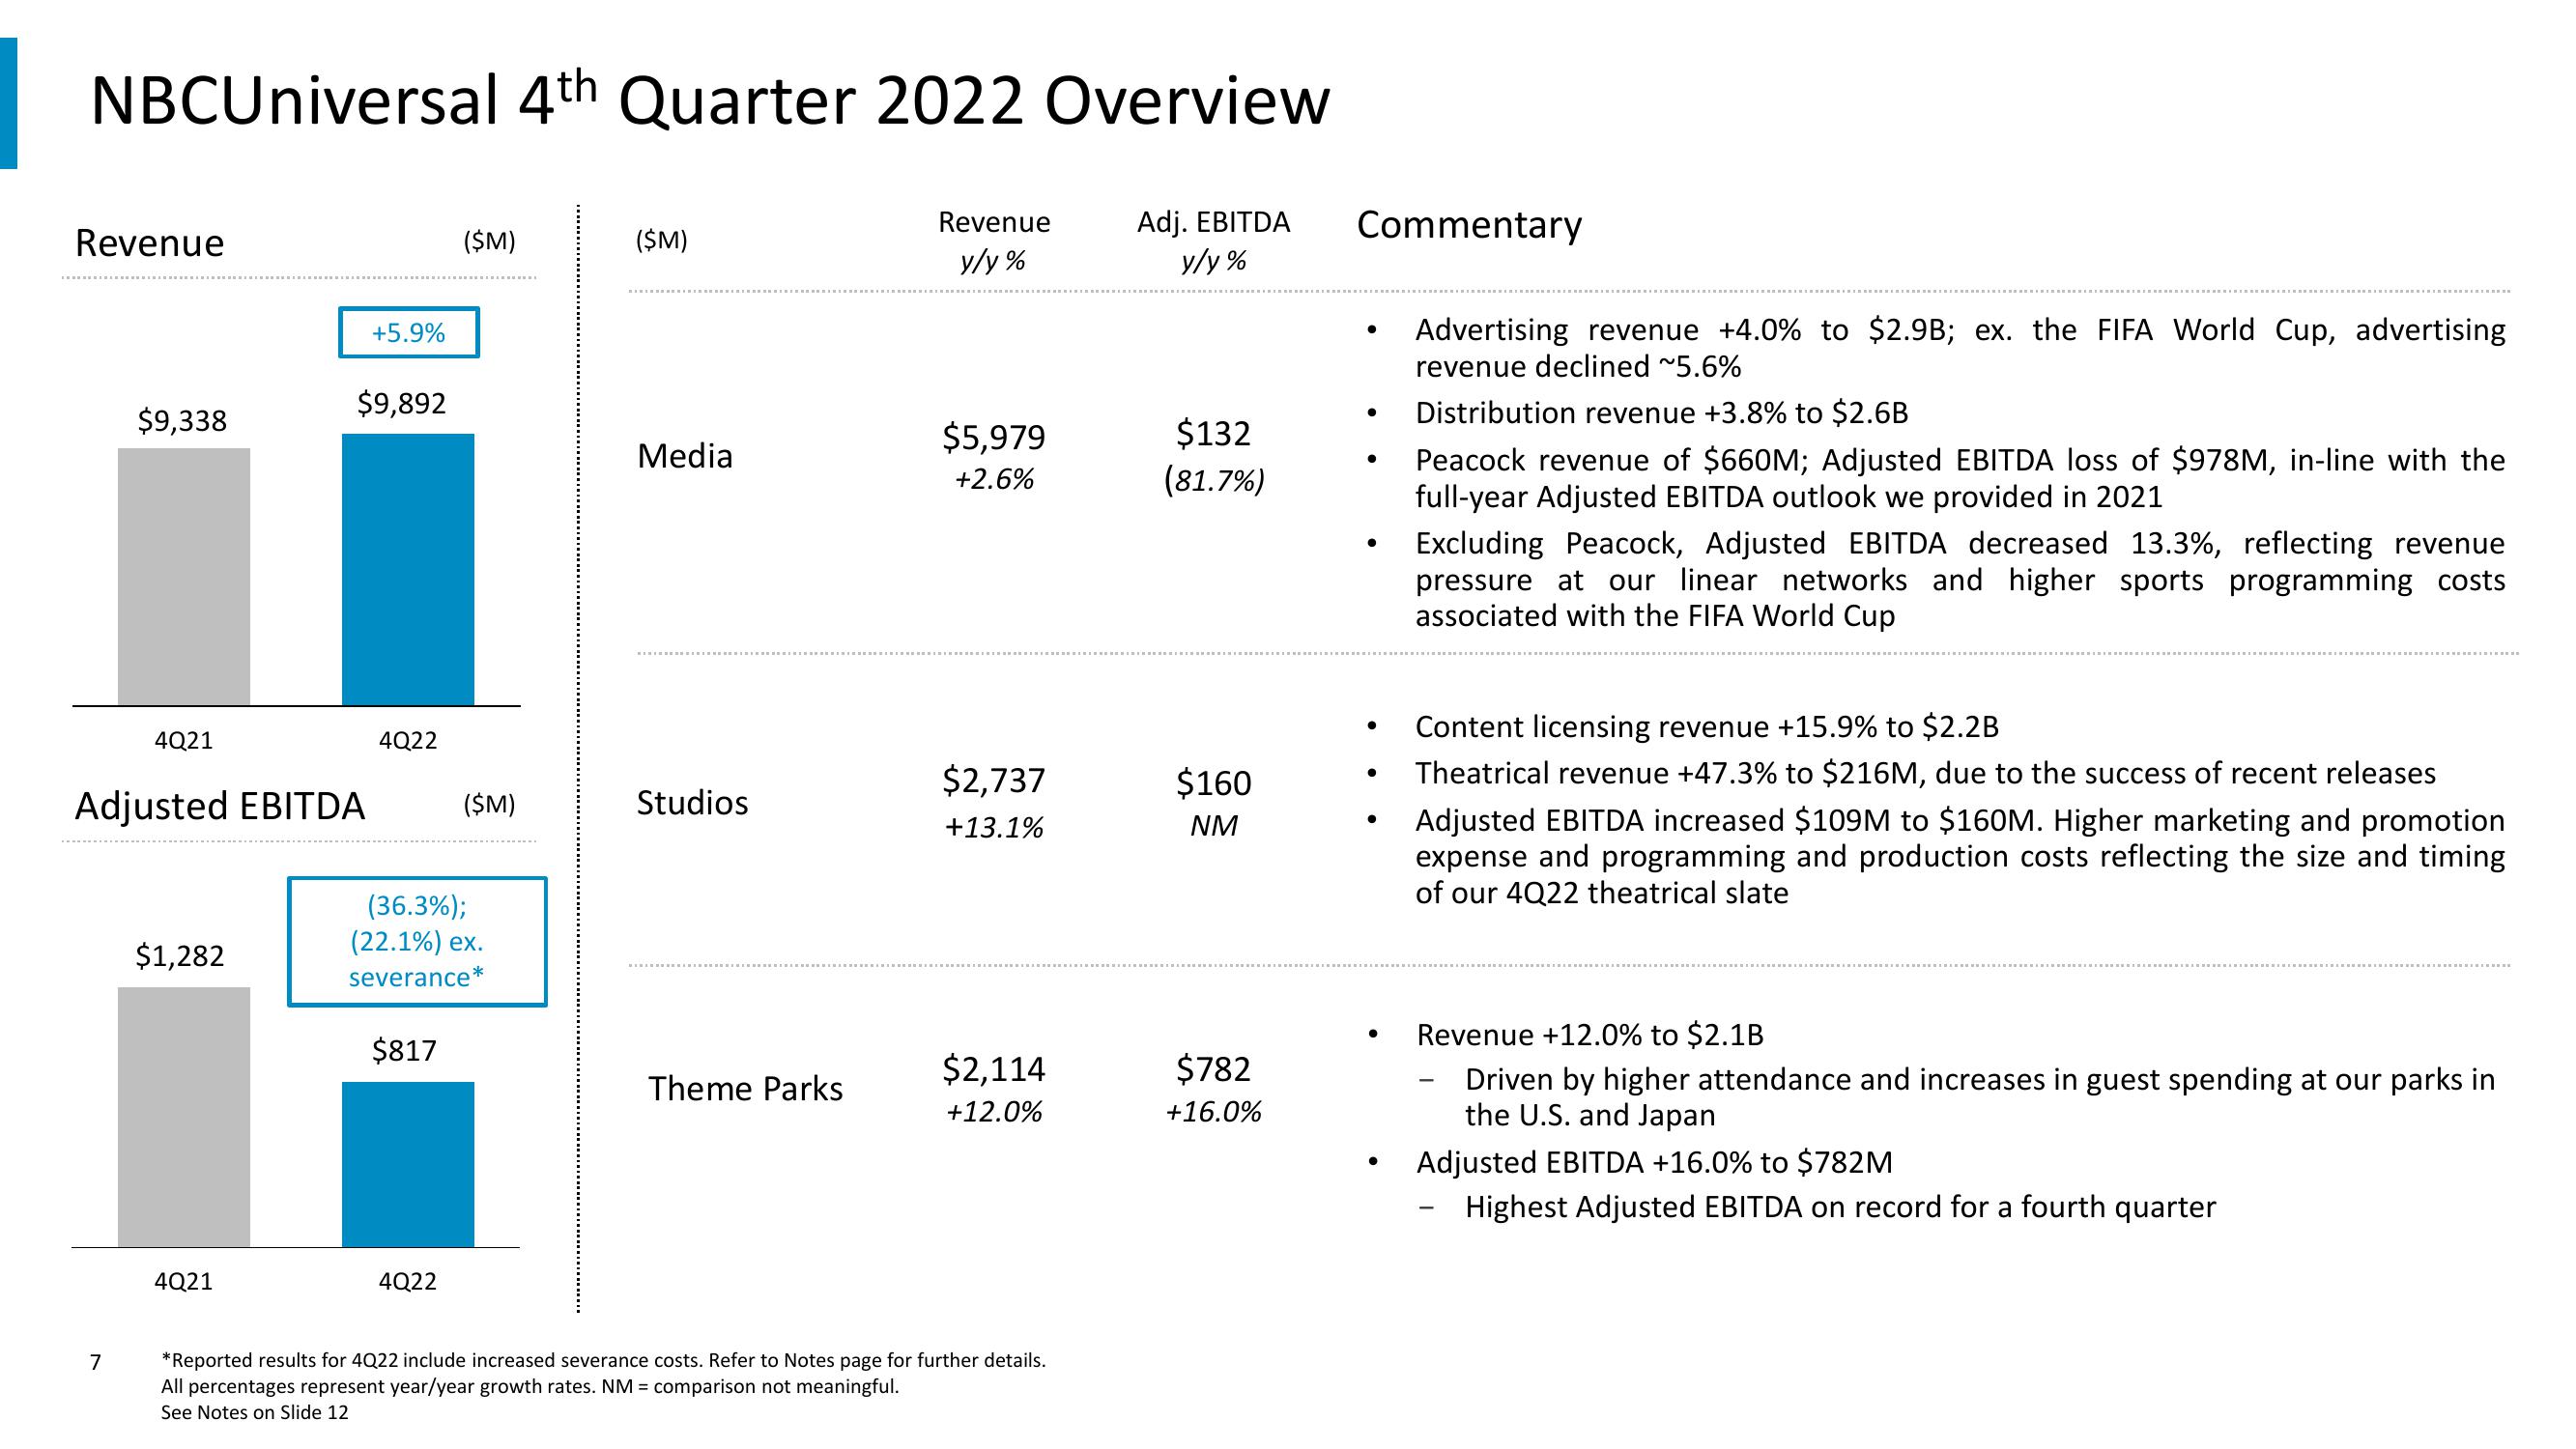
Advertising revenue +4.0% to $2.9B; ex. the FIFA World Cup, advertising
revenue declined ~5.6%
Distribution revenue +3.8% to $2.6B
Peacock revenue of $660M; Adjusted EBITDA loss of $978M, in-line with the
full-year Adjusted EBITDA outlook we provided in 2021
Excluding Peacock, Adjusted EBITDA decreased 13.3%, reflecting revenue
pressure at our linear networks and higher sports programming costs
associated with the FIFA World Cup
Content licensing revenue +15.9% to $2.2B
Theatrical revenue +47.3% to $216M, due to the success of recent releases
Adjusted EBITDA increased $109M to $160M. Higher marketing and promotion
expense and programming and production costs reflecting the size and timing
of our 4Q22 theatrical slate
Revenue +12.0% to $2.1B
Driven by higher attendance and increases in guest spending at our parks in
the U.S. and Japan
Adjusted EBITDA +16.0% to $782M
Highest Adjusted EBITDA on record for a fourth quarter
-View entire presentation