Xos SPAC Presentation Deck
Projected Path to Profitability
GROSS PROFIT (SMM)
% of Revenue
11.4% 29.5% 28.6% 30.3% 30.5%
$4
$78
$364
$905
30.6%
$1,598
$0
2020E 2021E 2022E 2023E 2024 2025E
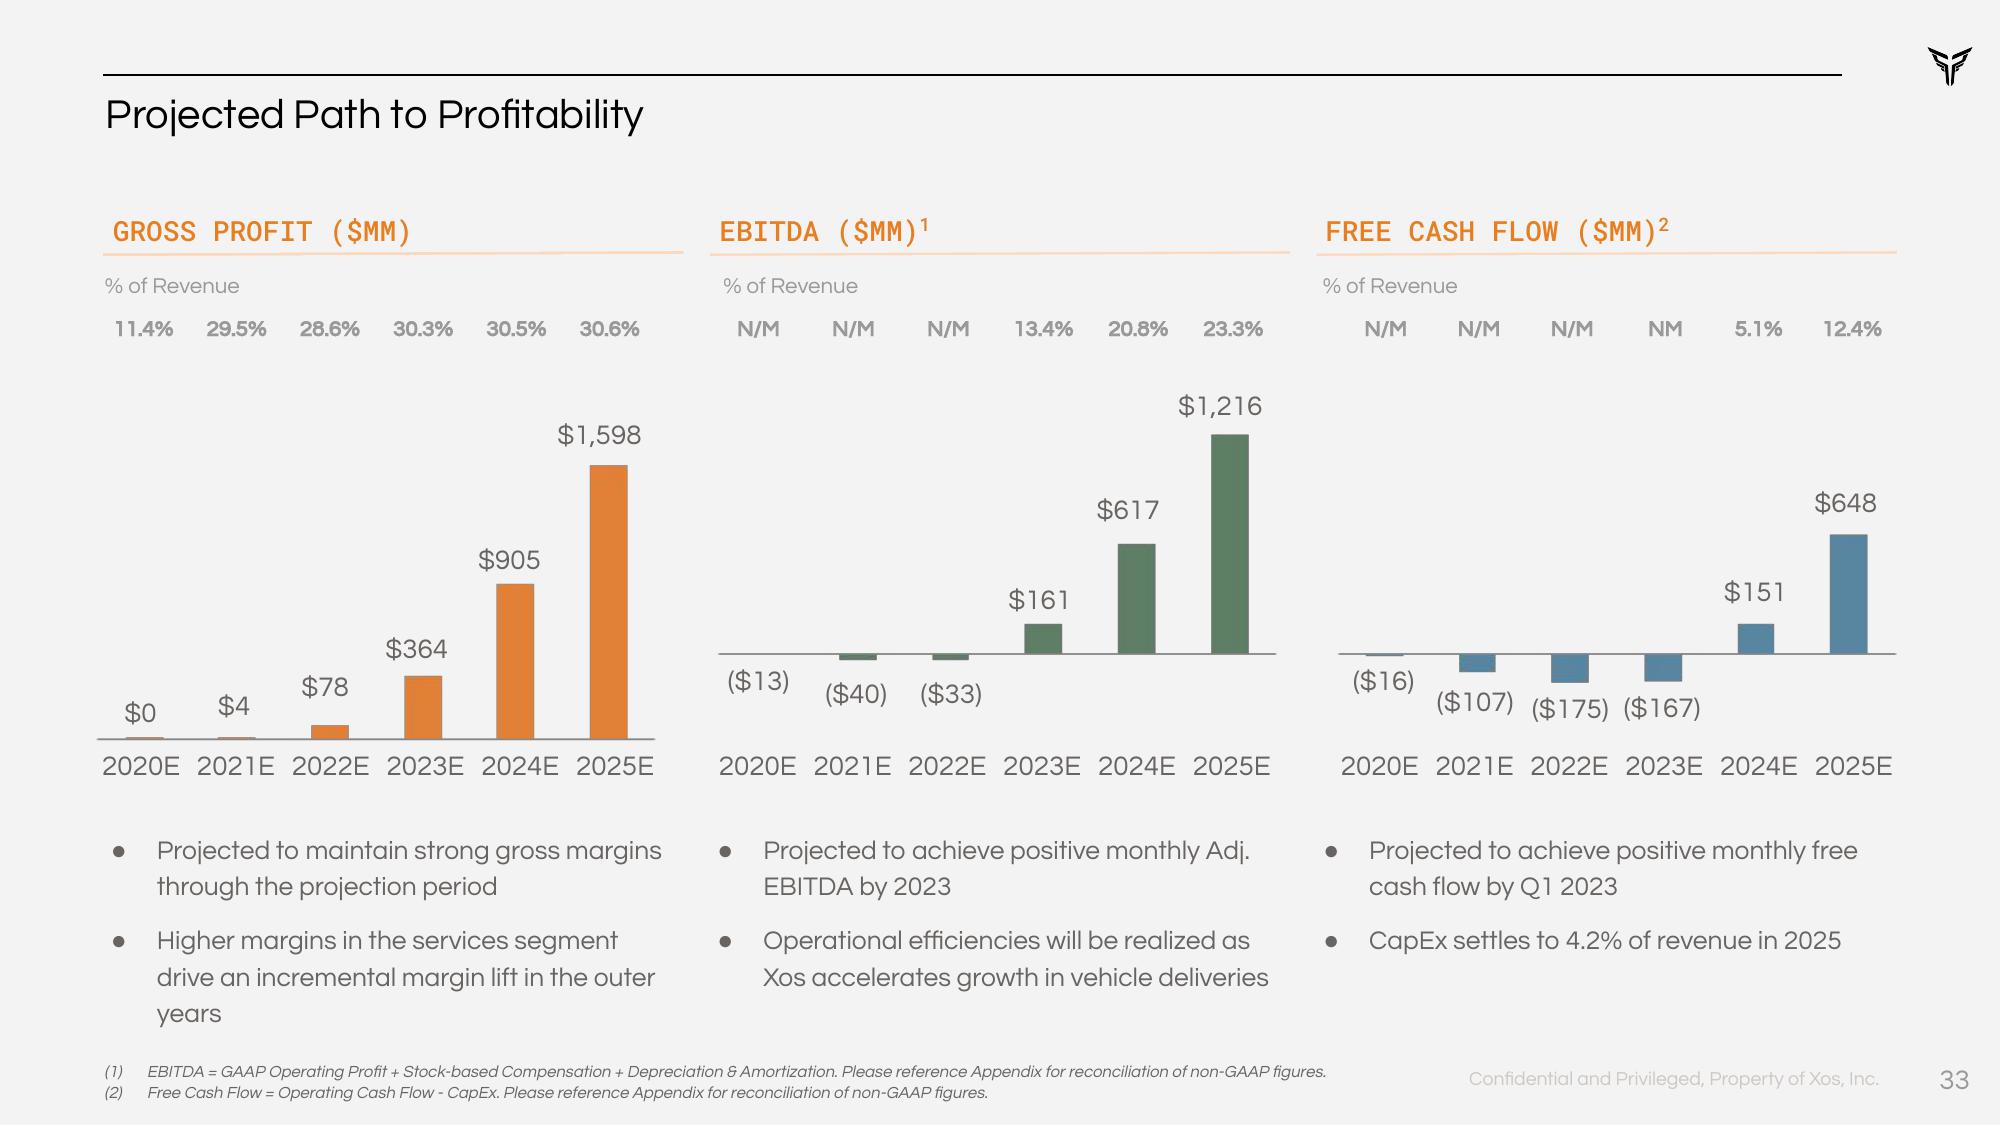
Projected to maintain strong gross margins
through the projection period
Higher margins in the services segment
drive an incremental margin lift in the outer
years
EBITDA ($MM)¹
% of Revenue
N/M
($13)
N/M
N/M
($40) ($33)
13.4%
$161
20.8%
$617
23.3%
$1,216
2020E 2021E 2022E 2023E 2024 2025E
Projected to achieve positive monthly Adj.
EBITDA by 2023
Operational efficiencies will be realized as
Xos accelerates growth in vehicle deliveries
FREE CASH FLOW (SMM) ²
% of Revenue
N/M
(7)
EBITDA = GAAP Operating Profit + Stock-based Compensation + Depreciation & Amortization. Please reference Appendix for reconciliation of non-GAAP figures.
(2) Free Cash Flow = Operating Cash Flow - CapEx. Please reference Appendix for reconciliation of non-GAAP figures.
($16)
N/M
N/M
NM
5.1% 12.4%
$151
$648
($107) ($175) ($167)
2020E 2021E 2022E 2023E 2024 2025E
● Projected to achieve positive monthly free
cash flow by Q1 2023
● CapEx settles to 4.2% of revenue in 2025
Confidential and Privileged, Property of Xos, Inc.
33View entire presentation