3Q24 Investor Update
Consolidated
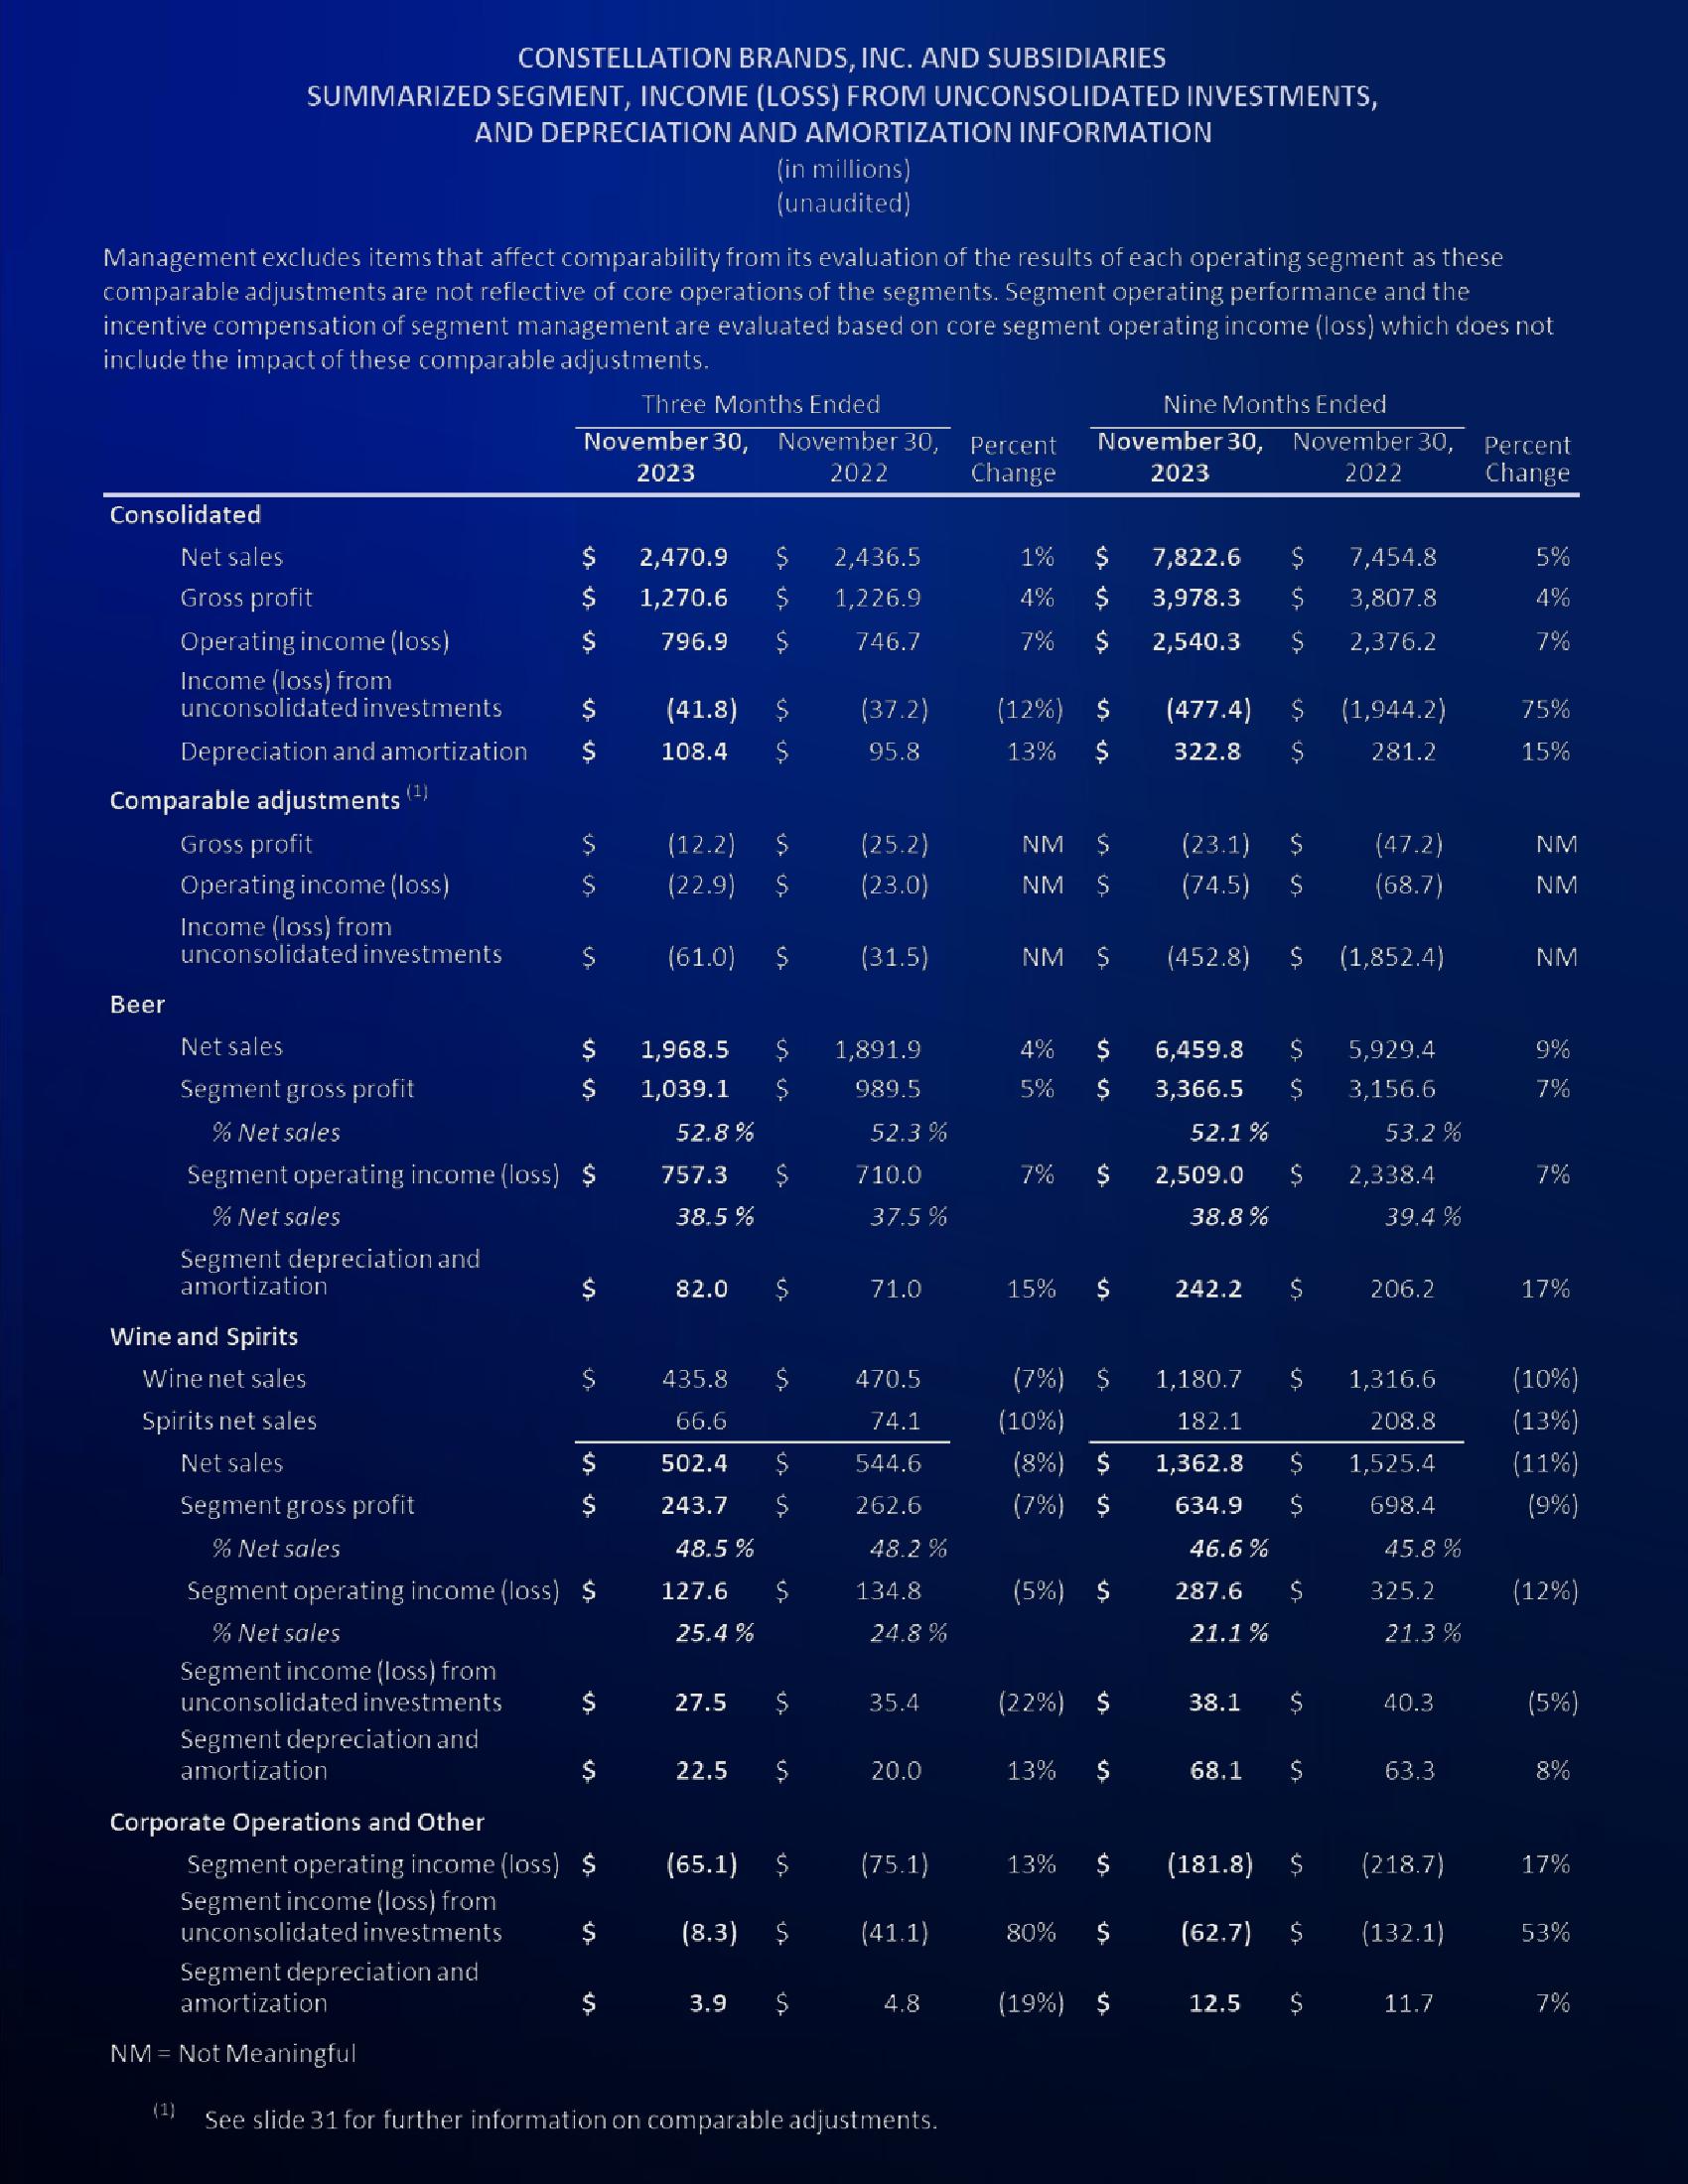
CONSTELLATION BRANDS, INC. AND SUBSIDIARIES
SUMMARIZED SEGMENT, INCOME (LOSS) FROM UNCONSOLIDATED INVESTMENTS,
AND DEPRECIATION AND AMORTIZATION INFORMATION
Management excludes items that affect comparability from its evaluation of the results of each operating segment as these
comparable adjustments are not reflective of core operations of the segments. Segment operating performance and the
incentive compensation of segment management are evaluated based on core segment operating income (loss) which does not
include the impact of these comparable adjustments.
Beer
Net sales
Gross profit
Operating income (loss)
Income (loss) from
unconsolidated investments
Depreciation and amortization
Comparable adjustments (¹)
Gross profit
Operating income (loss)
Income (loss) from
unconsolidated investments
Net sales
Segment gross profit
% Net sales
Segment depreciation and
amortization
Wine and Spirits
Wine net sales
Spirits net sales
Net sales
Segment gross profit
% Net sales
Segment depreciation and
amortization
Corporate Operations and Other
Three Months Ended
November 30, November 30, Percent
2023
2022
Change
$
$
$
$
Segment operating income (loss) $
% Net sales
$
Segment depreciation and
amortization
$
$
$
$
Segment operating income (loss) $
% Net sales
Segment income (loss) from
unconsolidated investments
$
$
$
$
Segment operating income (loss) $
Segment income (loss) from
unconsolidated investments
2,470.9
1,270.6
796.9
1,968.5
1,039.1
$
(41.8)
108.4 $
52.8%
$
(12.2)
(22.9) $
(61.0)
757.3
38.5%
82.0
435.8
66.6
502.4
243.7
48.5%
127.6
(in millions)
(unaudited)
25.4%
27.5
22.5
is in in
$
3.9
in in
$
$
$
in
$
$
$
in
2,436.5
1,226.9
746.7
(37.2)
95.8
(25.2)
(23.0)
(31.5)
1,891.9
989.5
52.3 %
710.0
37.5%
71.0
470.5
74.1
544.6
262.6
48.2 %
134.8
24.8%
35.4
20.0
(65.1) $ (75.1)
(8.3) $
(41.1)
$
4.8
NM = Not Meaningful
(1) See slide 31 for further information on comparable adjustments.
1% $
4% $
7% $
(12%) $
13% $
NM $
NM $
NM $
Nine Months Ended
November 30, November 30, Percent
2023
2022
Change
4% $
5%
$
7%
15% $
(7%) $
(10%)
(8%) $
(7%) $
(5%) $
(22%) $
13%
13%
80%
$
(19%) $
7,822.6 $
3,978.3 $
2,540.3 $
(477.4) $ (1,944.2)
322.8 $
281.2
(23.1) $
(74.5) $
(452.8) $
6,459.8 $
3,366.5 $
52.1%
2,509.0 $
38.8%
242.2
1,180.7 $
182.1
38.1
68.1
$
$
7,454.8
3,807.8
2,376.2
(181.8) $
(62.7) $
12.5 $
(47.2)
(68.7)
1,316.6
208.8
1,362.8 $ 1,525.4
698.4
634.9 $
46.6%
287.6 $
21.1%
(1,852.4)
5,929.4
3,156.6
53.2 %
2,338.4
39.4%
206.2
45.8%
325.2
21.3%
40.3
63.3
(218.7)
(132.1)
11.7
5%
4%
7%
75%
15%
NM
NM
NM
9%
7%
7%
17%
(10%)
(13%)
(11%)
(9%)
(12%)
(5%)
8%
17%
53%
7%View entire presentation