Ready Capital Investor Presentation Deck
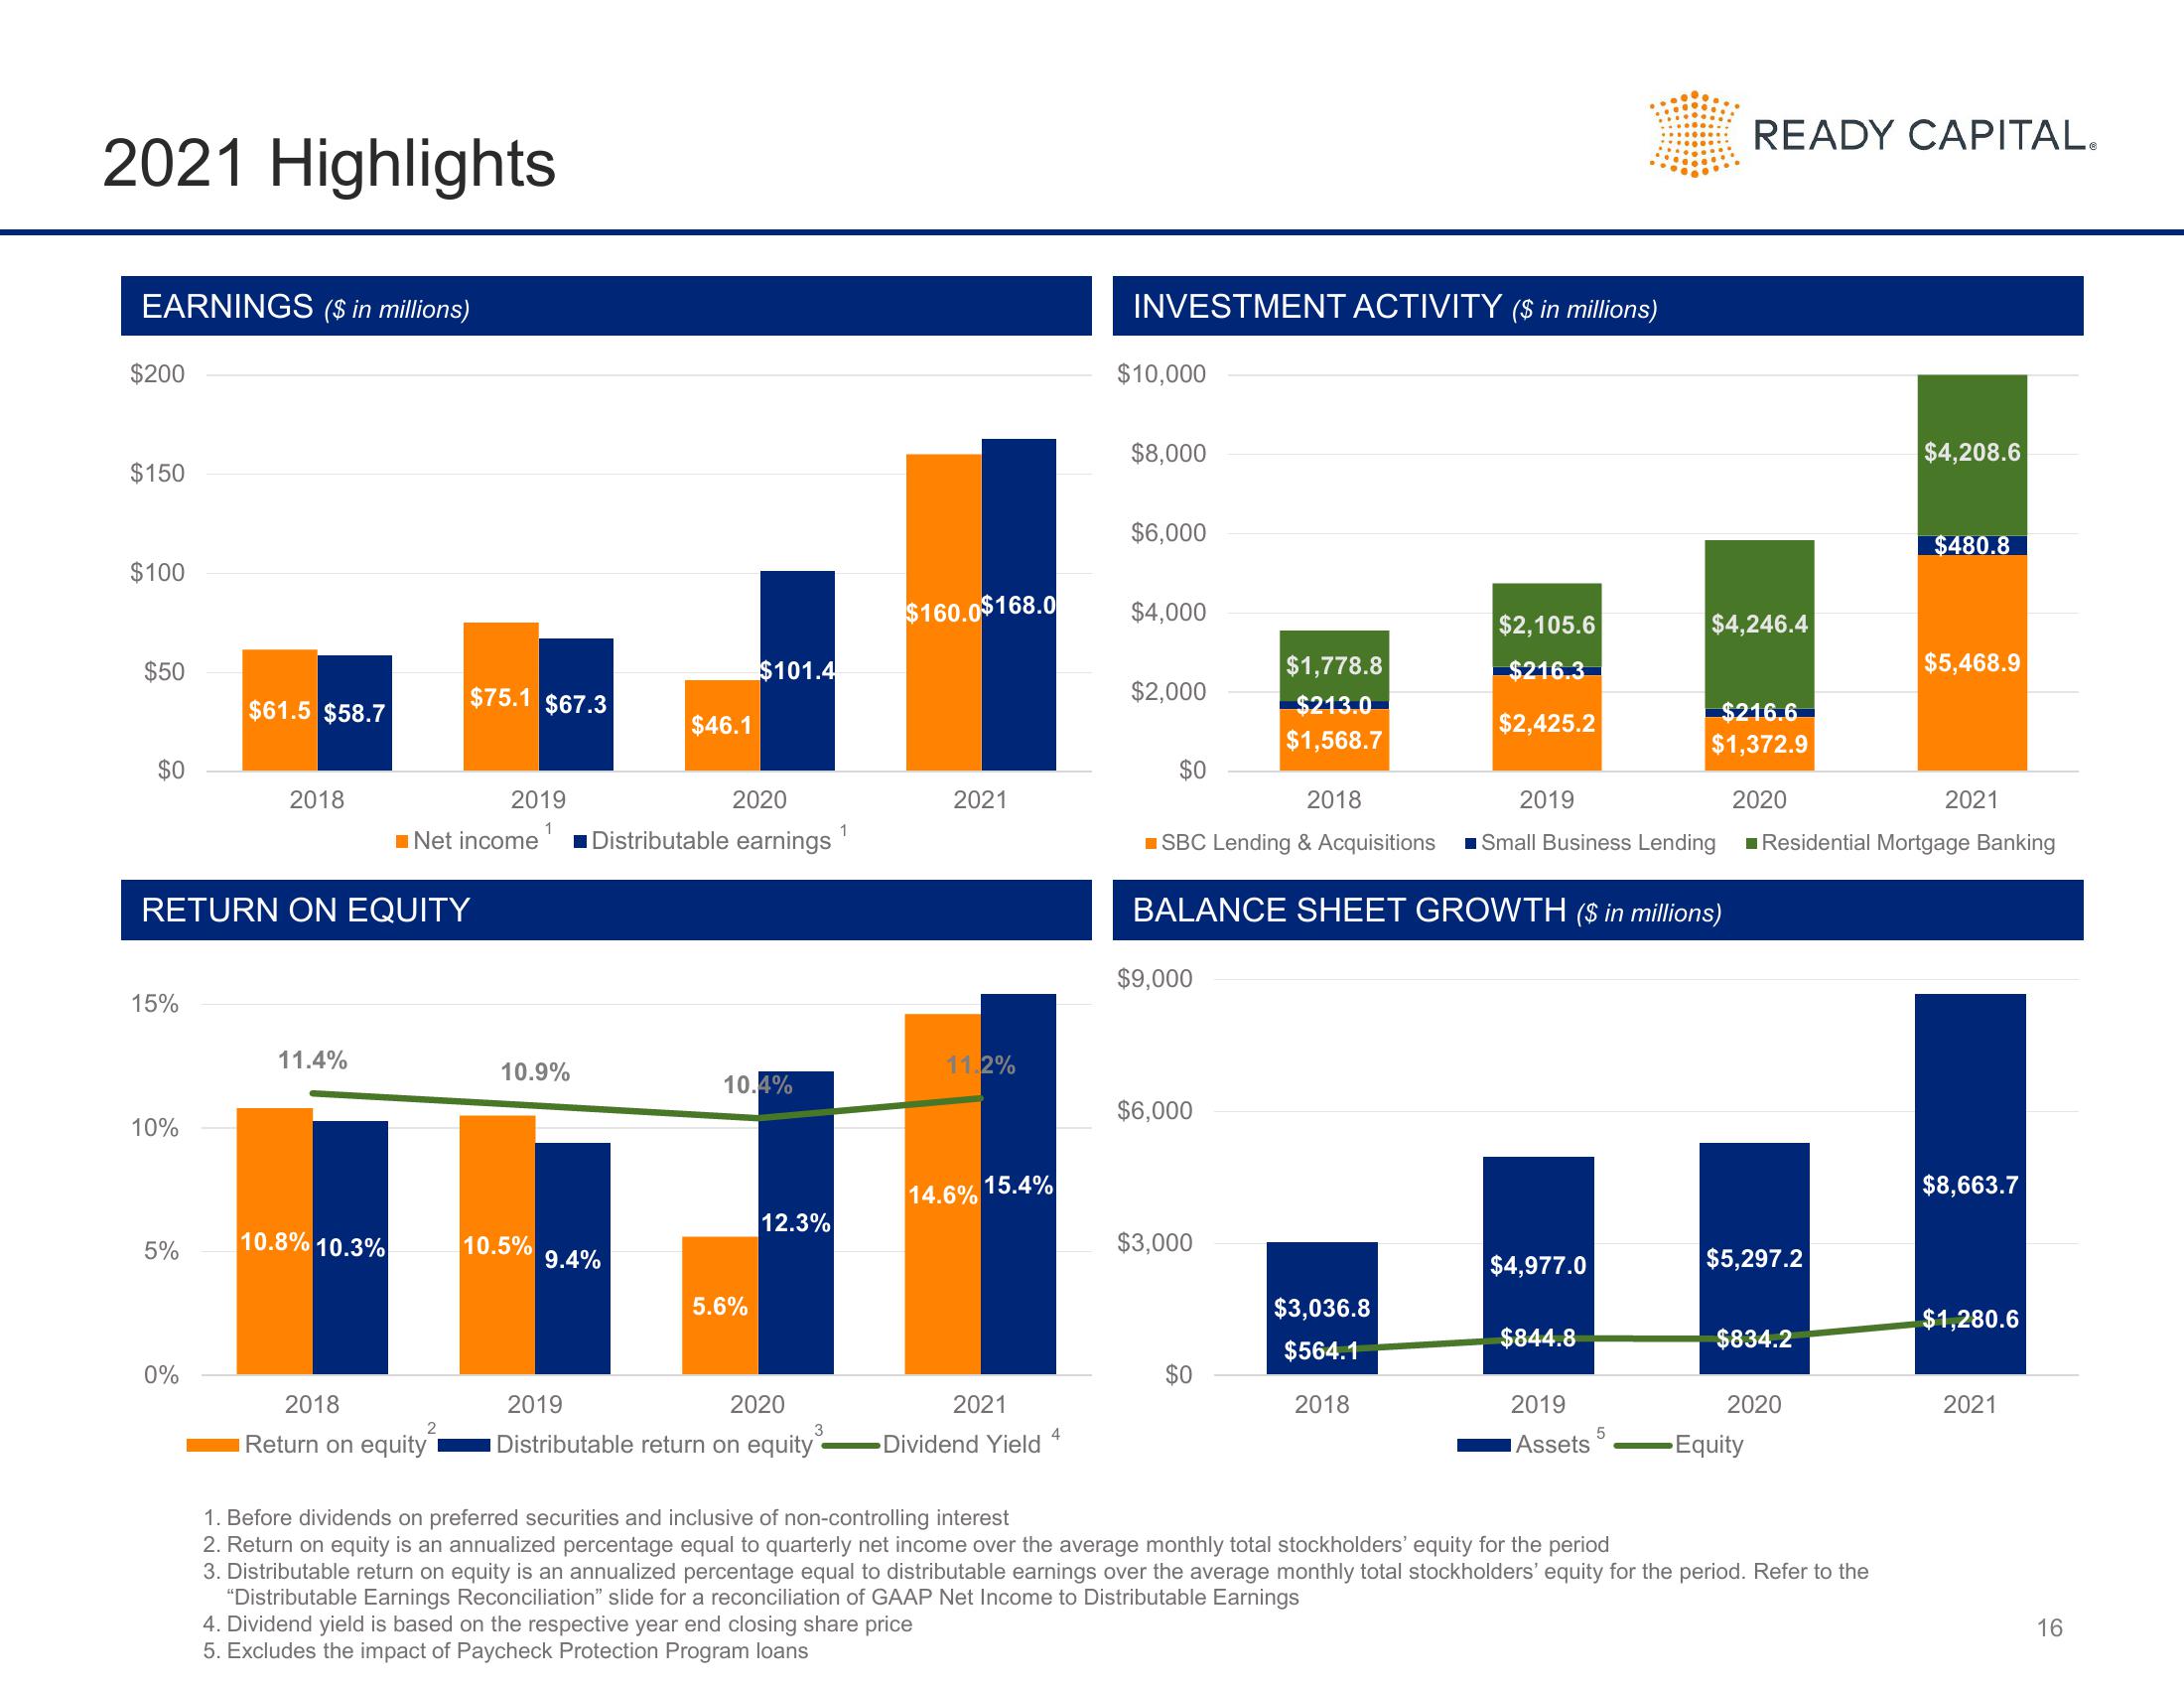
2021 Highlights
EARNINGS ($ in millions)
$200
$150
$100
$50
$0
15%
10%
RETURN ON EQUITY
5%
$61.5 $58.7
0%
2018
11.4%
10.8% 10.3%
$75.1 $67.3
Net income
2018
2
Return on equity
2019
1
10.9%
10.5%
$46.1
9.4%
2020
Distributable earnings
$101.4
10.4%
5.6%
12.3%
2019
2020
Distributable return on equity
3
1
$160.0$168.0
2021
11.2%
14.6%
4. Dividend yield is based on the respective year end closing share price
5. Excludes the impact of Paycheck Protection Program loans
15.4%
2021
Dividend Yield
4
INVESTMENT ACTIVITY ($ in millions)
$10,000
$8,000
$6,000
$4,000
$2,000
$1,778.8
$213.0
$1,568.7
2018
■SBC Lending & Acquisitions
2019
Small Business Lending
BALANCE SHEET GROWTH ($ in millions)
$0
$9,000
$6,000
$3,000
$0
$2,105.6
$216.3
$2,425.2
$3,036.8
$564.1
2018
$4,977.0
$844.8
2019
Assets
5
$4,246.4
READY CAPITAL.
$216.6
$1,372.9
2020
$5,297.2
$834.2
Equity
2020
1. Before dividends on preferred securities and inclusive of non-controlling interest
2. Return on equity is an annualized percentage equal to quarterly net income over the average monthly total stockholders' equity for the period
3. Distributable return on equity is an annualized percentage equal to distributable earnings over the average monthly total stockholders' equity for the period. Refer to the
"Distributable Earnings Reconciliation" slide for a reconciliation of GAAP Net Income to Distributable Earnings
$4,208.6
Residential Mortgage Banking
$480.8
$5,468.9
2021
$8,663.7
$1,280.6
2021
16View entire presentation