BigCommerce Results Presentation Deck slide image

BigCommerce Results Presentation Deck

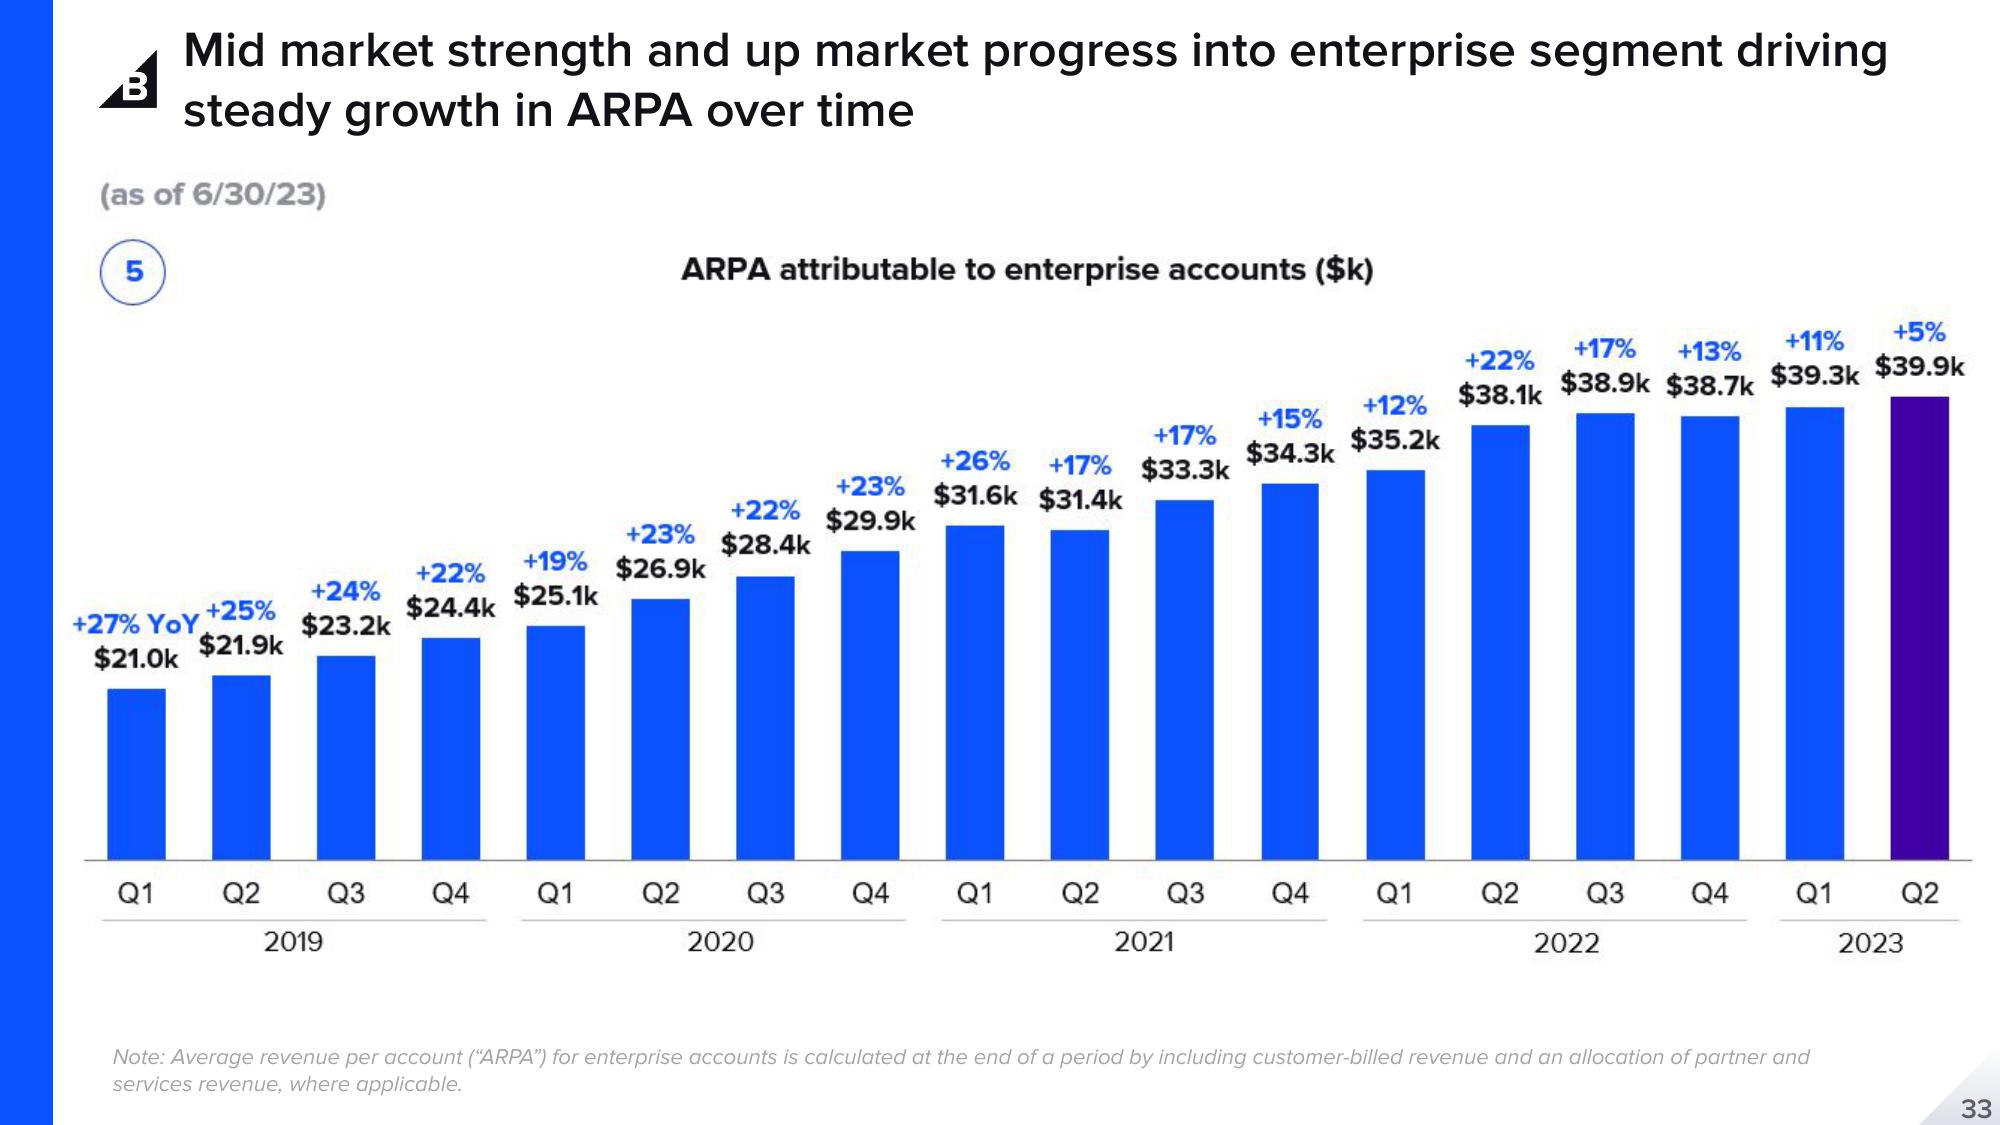
Mid market strength and up market progress into enterprise segment driving B steady growth in ARPA over time (as of 6/30/23) 5 +25% $21.9k +27% YoY $21.0k Q1 +24% $23.2k +22% $24.4k 2019 Q2 Q3 Q4 Q1 ARPA attributable to enterprise accounts ($k) +17% +26% +17% $33.3k +23% $31.6k $31.4k +22% $29.9k +23% $28.4k +19% $26.9k $25.1k 11 Q1 Q2 Q3 2020 Q4 Q2 +15% $34.3k Q3 Q4 2021 +22% $38.1k +12% $35.2k Q1 +17% +13% $38.9k $38.7k Q2 +11% +5% $39.3k $39.9k Q3 Q4 Q1 Q2 2022 Note: Average revenue per account ("ARPA") for enterprise accounts is calculated at the end of a period by including customer-billed revenue and an allocation of partner and services revenue, where applicable. 2023 33
View entire presentation