Meyer Burger Investor Presentation
Diversifying world solar market
for end-installed capacity
MEYER BURGER
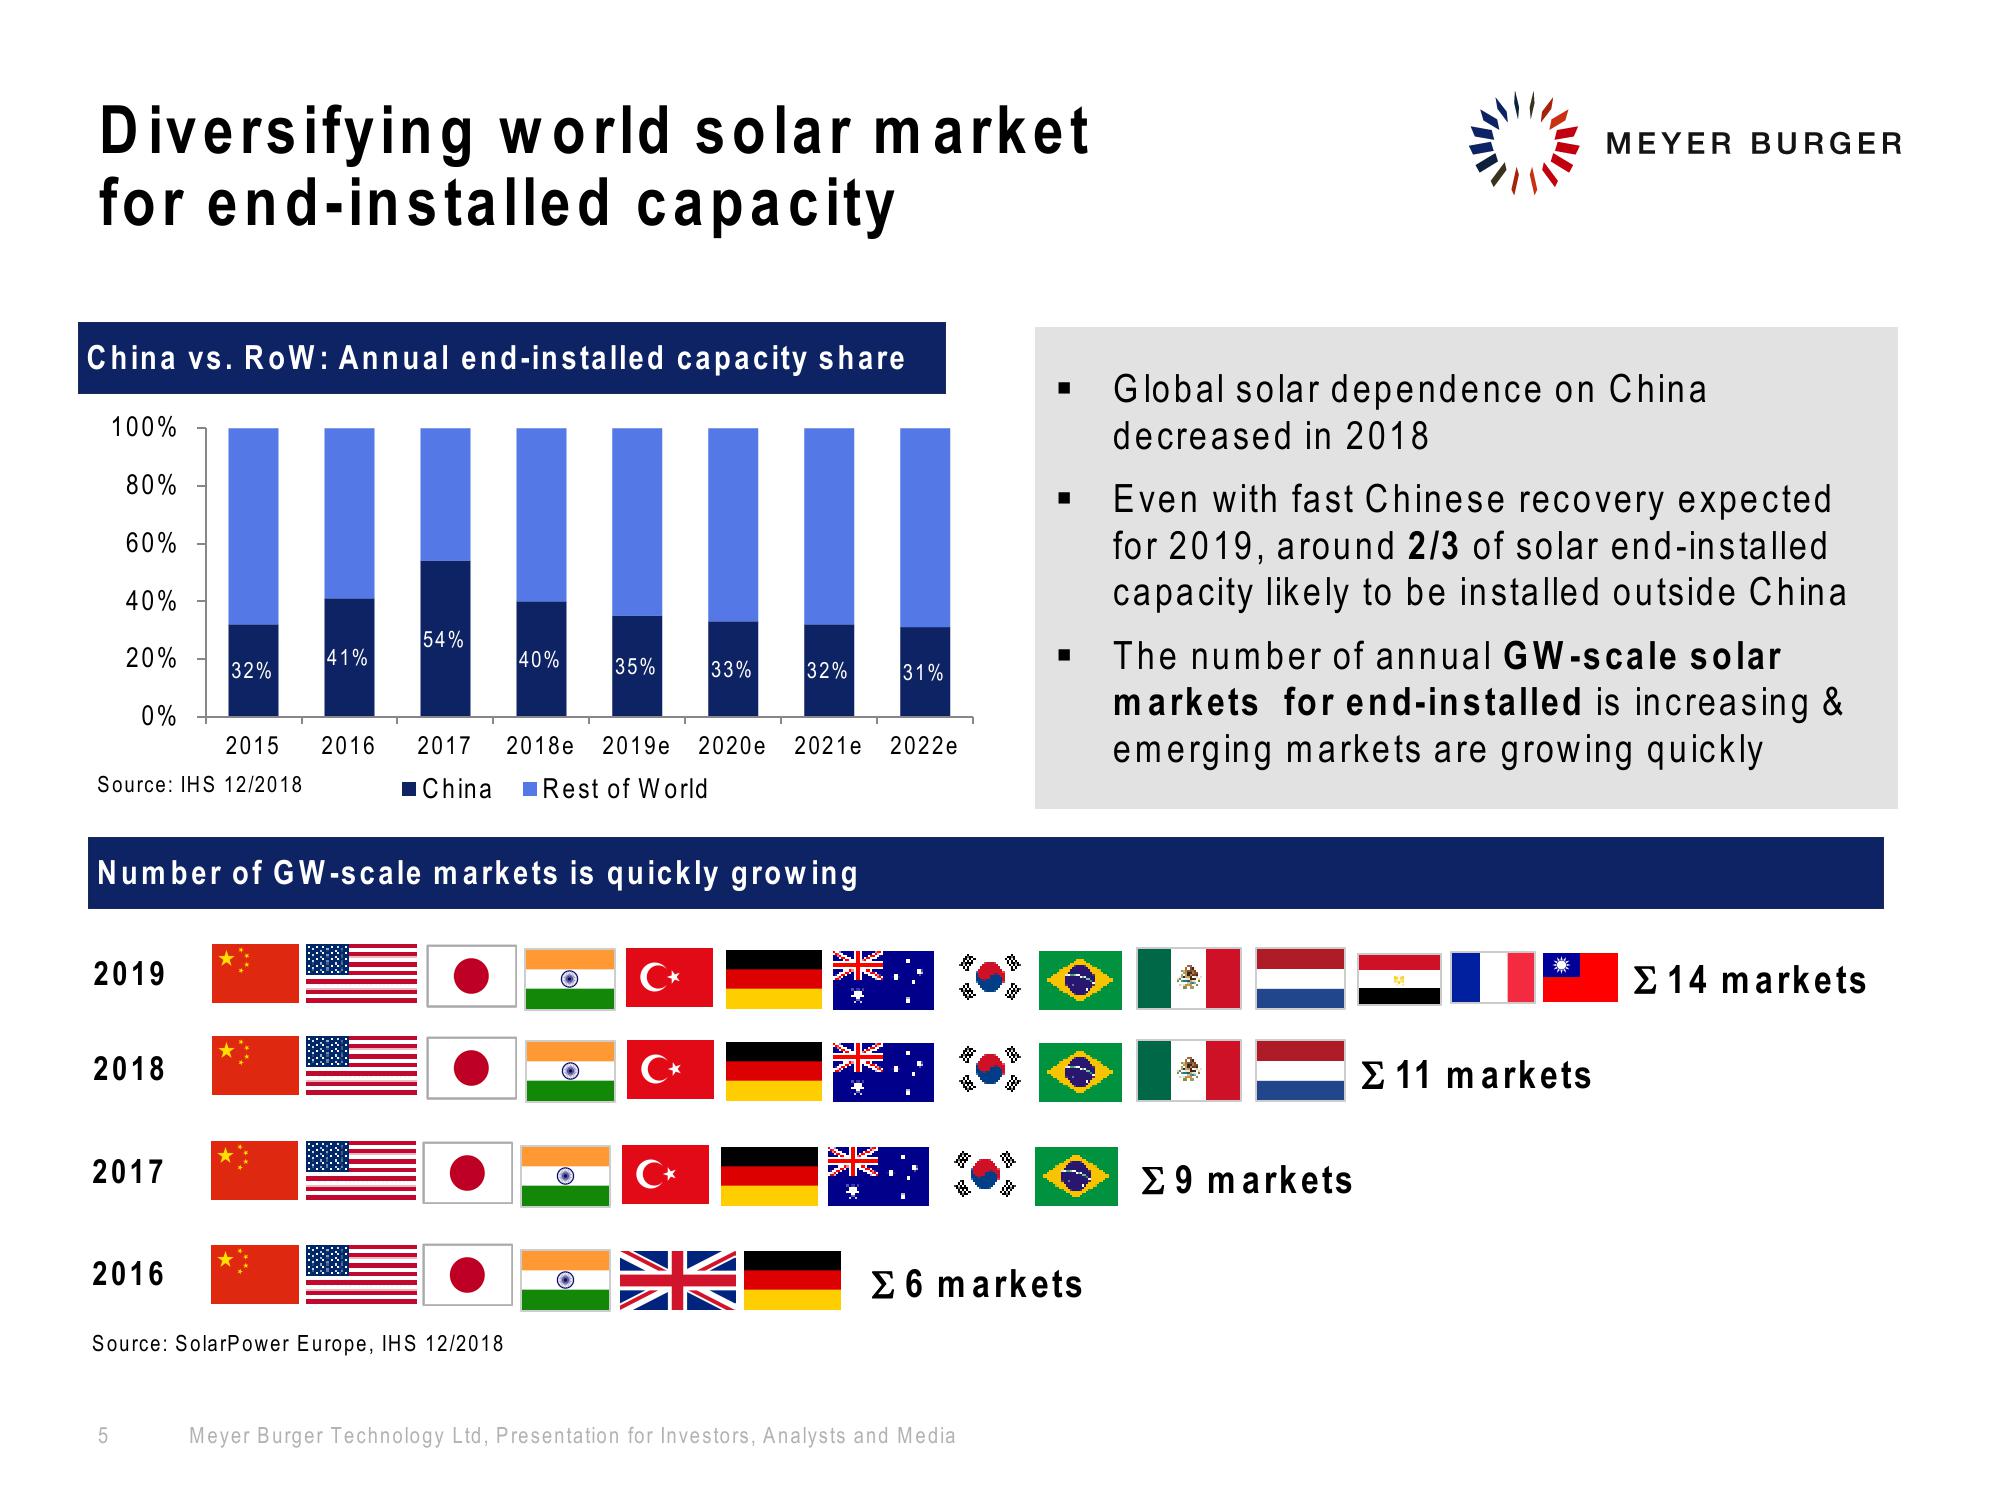
China vs. RoW: Annual end-installed capacity share
100%
80%
60%
40%
54%
20%
41%
40%
32%
35%
33%
32%
31%
0%
2015 2016 2017 2018e
Source: IHS 12/2018
■China
2019e
Rest of World
2020e 2021e 2022e
Global solar dependence on China
decreased in 2018
Even with fast Chinese recovery expected
for 2019, around 2/3 of solar end-installed
capacity likely to be installed outside China.
The number of annual GW-scale solar
markets for end-installed is increasing &
emerging markets are growing quickly
Number of GW-scale markets is quickly growing
2019
2018
2017
2016
Source: SolarPower Europe, IHS 12/2018
C⭑
O
C⭑
O
C⭑
M==
*Σ11 markets
Σ 14 markets
Σ 9 markets
Σ 6 markets
5
Meyer Burger Technology Ltd, Presentation for Investors, Analysts and MediaView entire presentation