Bird SPAC Presentation Deck
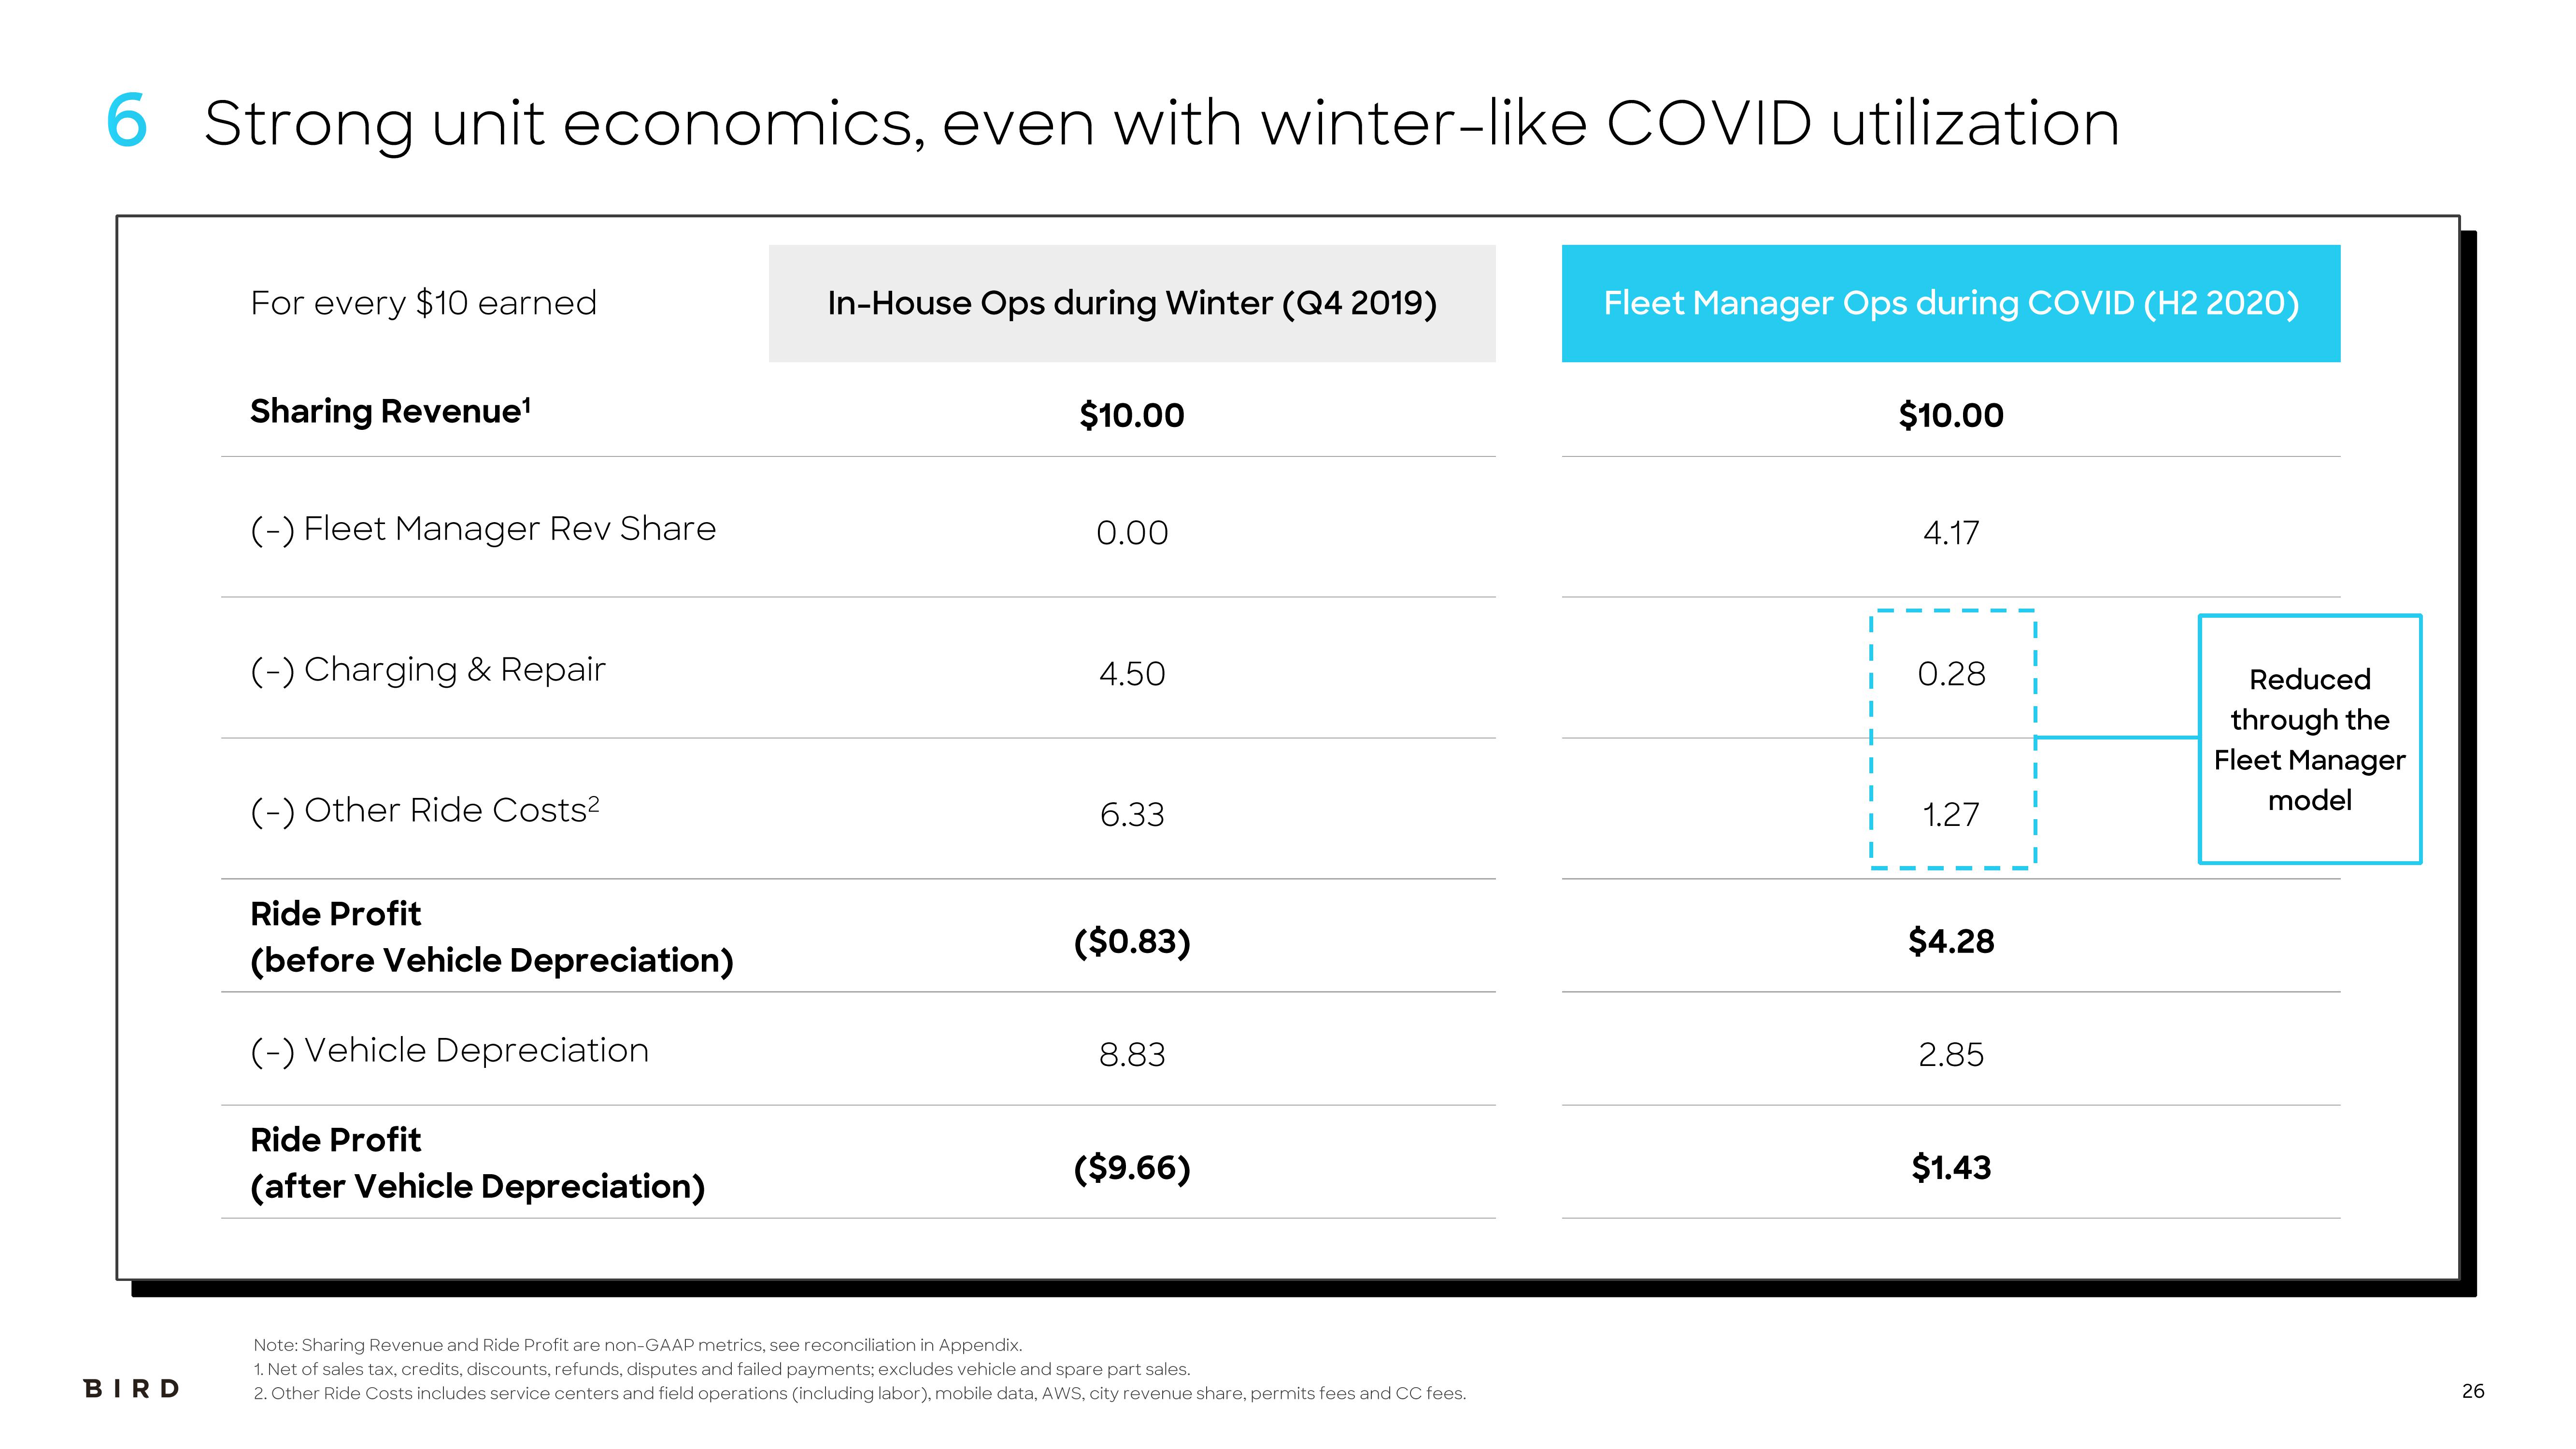
6 Strong unit economics, even with winter-like COVID utilization
BIRD
For every $10 earned
Sharing Revenue¹
(-) Fleet Manager Rev Share
(-) Charging & Repair
(-) Other Ride Costs²
Ride Profit
(before Vehicle Depreciation)
(-) Vehicle Depreciation
Ride Profit
(after Vehicle Depreciation)
In-House Ops during Winter (Q4 2019)
$10.00
0.00
4.50
6.33
($0.83)
8.83
($9.66)
Note: Sharing Revenue and Ride Profit are non-GAAP metrics, see reconciliation in Appendix.
1. Net of sales tax, credits, discounts, refunds, disputes and failed payments; excludes vehicle and spare part sales.
2. Other Ride Costs includes service centers and field operations (including labor), mobile data, AWS, city revenue share, permits fees and CC fees.
Fleet Manager Ops during COVID (H2 2020)
$10.00
4.17
0.28
1.27
$4.28
2.85
$1.43
Reduced
through the
Fleet Manager
model
26View entire presentation