Baird Investment Banking Pitch Book
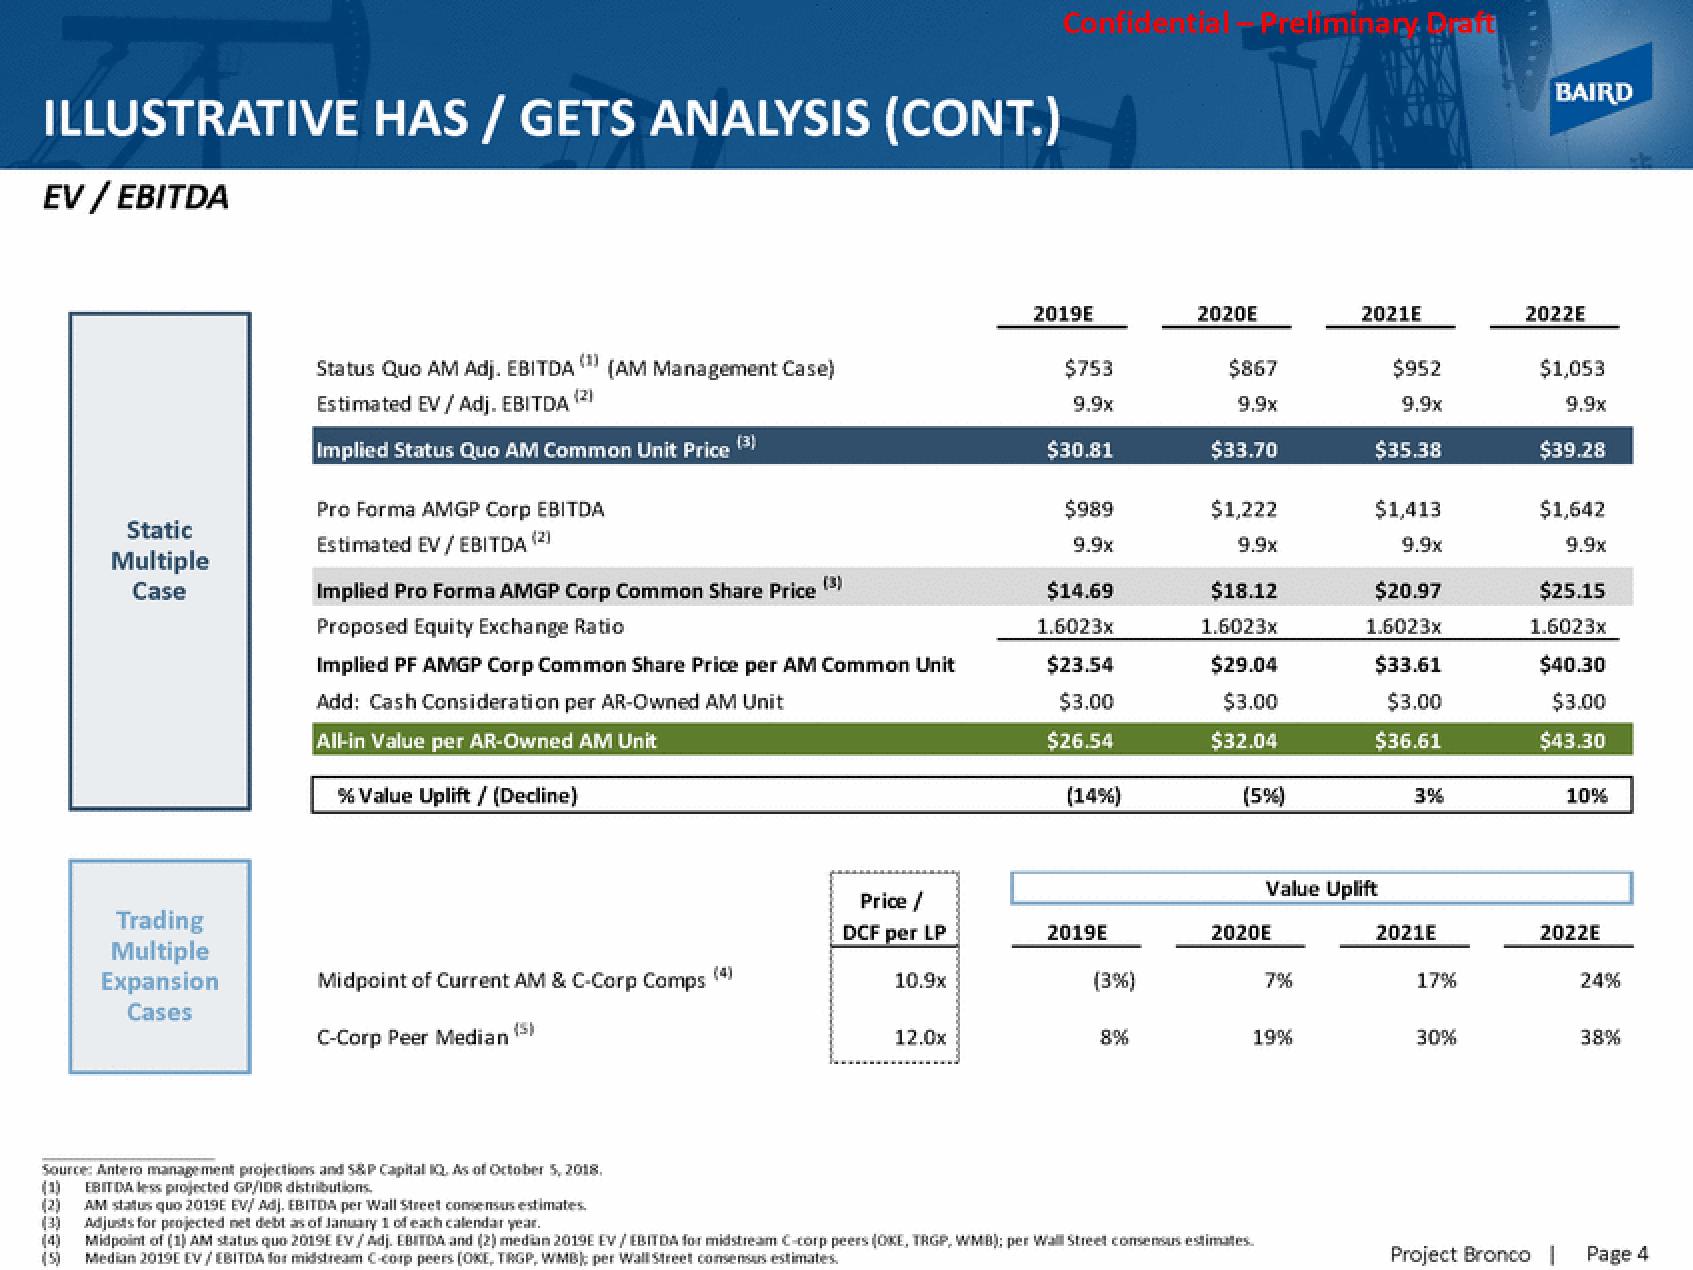
ILLUSTRATIVE HAS / GETS ANALYSIS (CONT.)
EV/EBITDA
(1)
(2)
(3)
Static
Multiple
Case
(5)
Trading
Multiple
Expansion
Cases
Status Quo AM Adj. EBITDA (AM Management Case)
Estimated EV / Adj. EBITDA
Implied Status Quo AM Common Unit Price (3)
Pro Forma AMGP Corp EBITDA
Estimated EV / EBITDA (2)
(3)
Implied Pro Forma AMGP Corp Common Share Price
Proposed Equity Exchange Ratio
Implied PF AMGP Corp Common Share Price per AM Common Unit
Add: Cash Consideration per AR-Owned AM Unit
All-in Value per AR-Owned AM Unit
% Value Uplift / (Decline)
Source: Antero management projections and S&P Capital IQ. As of October 5, 2018.
EBITDA less projected GP/IDR distributions.
Midpoint of Current AM & C-Corp Comps
C-Corp Peer Median
Price /
DCF per LP
10.9x
12.0x
2019E
$753
9.9x
$30.81
$989
9.9x
$14.69
1.6023x
$23.54
$3.00
$26.54
(14%)
2019E
(3%)
8%
Preliminar. Prant
2020E
$867
9.9x
$33.70
$1,222
9.9x
$18.12
1.6023x
$29.04
$3.00
$32.04
(5%)
2020E
AM status quo 2019E EV/ Adj. EBITDA per Wall Street consensus estimates.
Adjusts for projected net debt as of January 1 of each calendar year.
Midpoint of (1) AM status quo 2019E EV / Adj. EBITDA and (2) median 2019E EV/EBITDA for midstream C-corp peers (OKE, TRGP, WMB): per Wall Street consensus estimates.
Median 2019E EV / EBITDA for midstream C-corp peers (OKE, TRGP, WMB) per Wall Street consensus estimates.
7%
19%
2021E
$952
9.9x
$35.38
$1,413
9.9x
Value Uplift
$20.97
1.6023x
$33.61
$3.00
$36.61
3%
2021E
17%
30%
BAIRD
2022E
Project Bronco
$1,053
9.9x
$39.28
$1,642
9.9x
$25.15
1.6023x
$40.30
$3.00
$43.30
10%
2022E
24%
38%
Page 4View entire presentation