GMS Results Presentation Deck
Attractive Capital Structure Supports Strategic Priorities
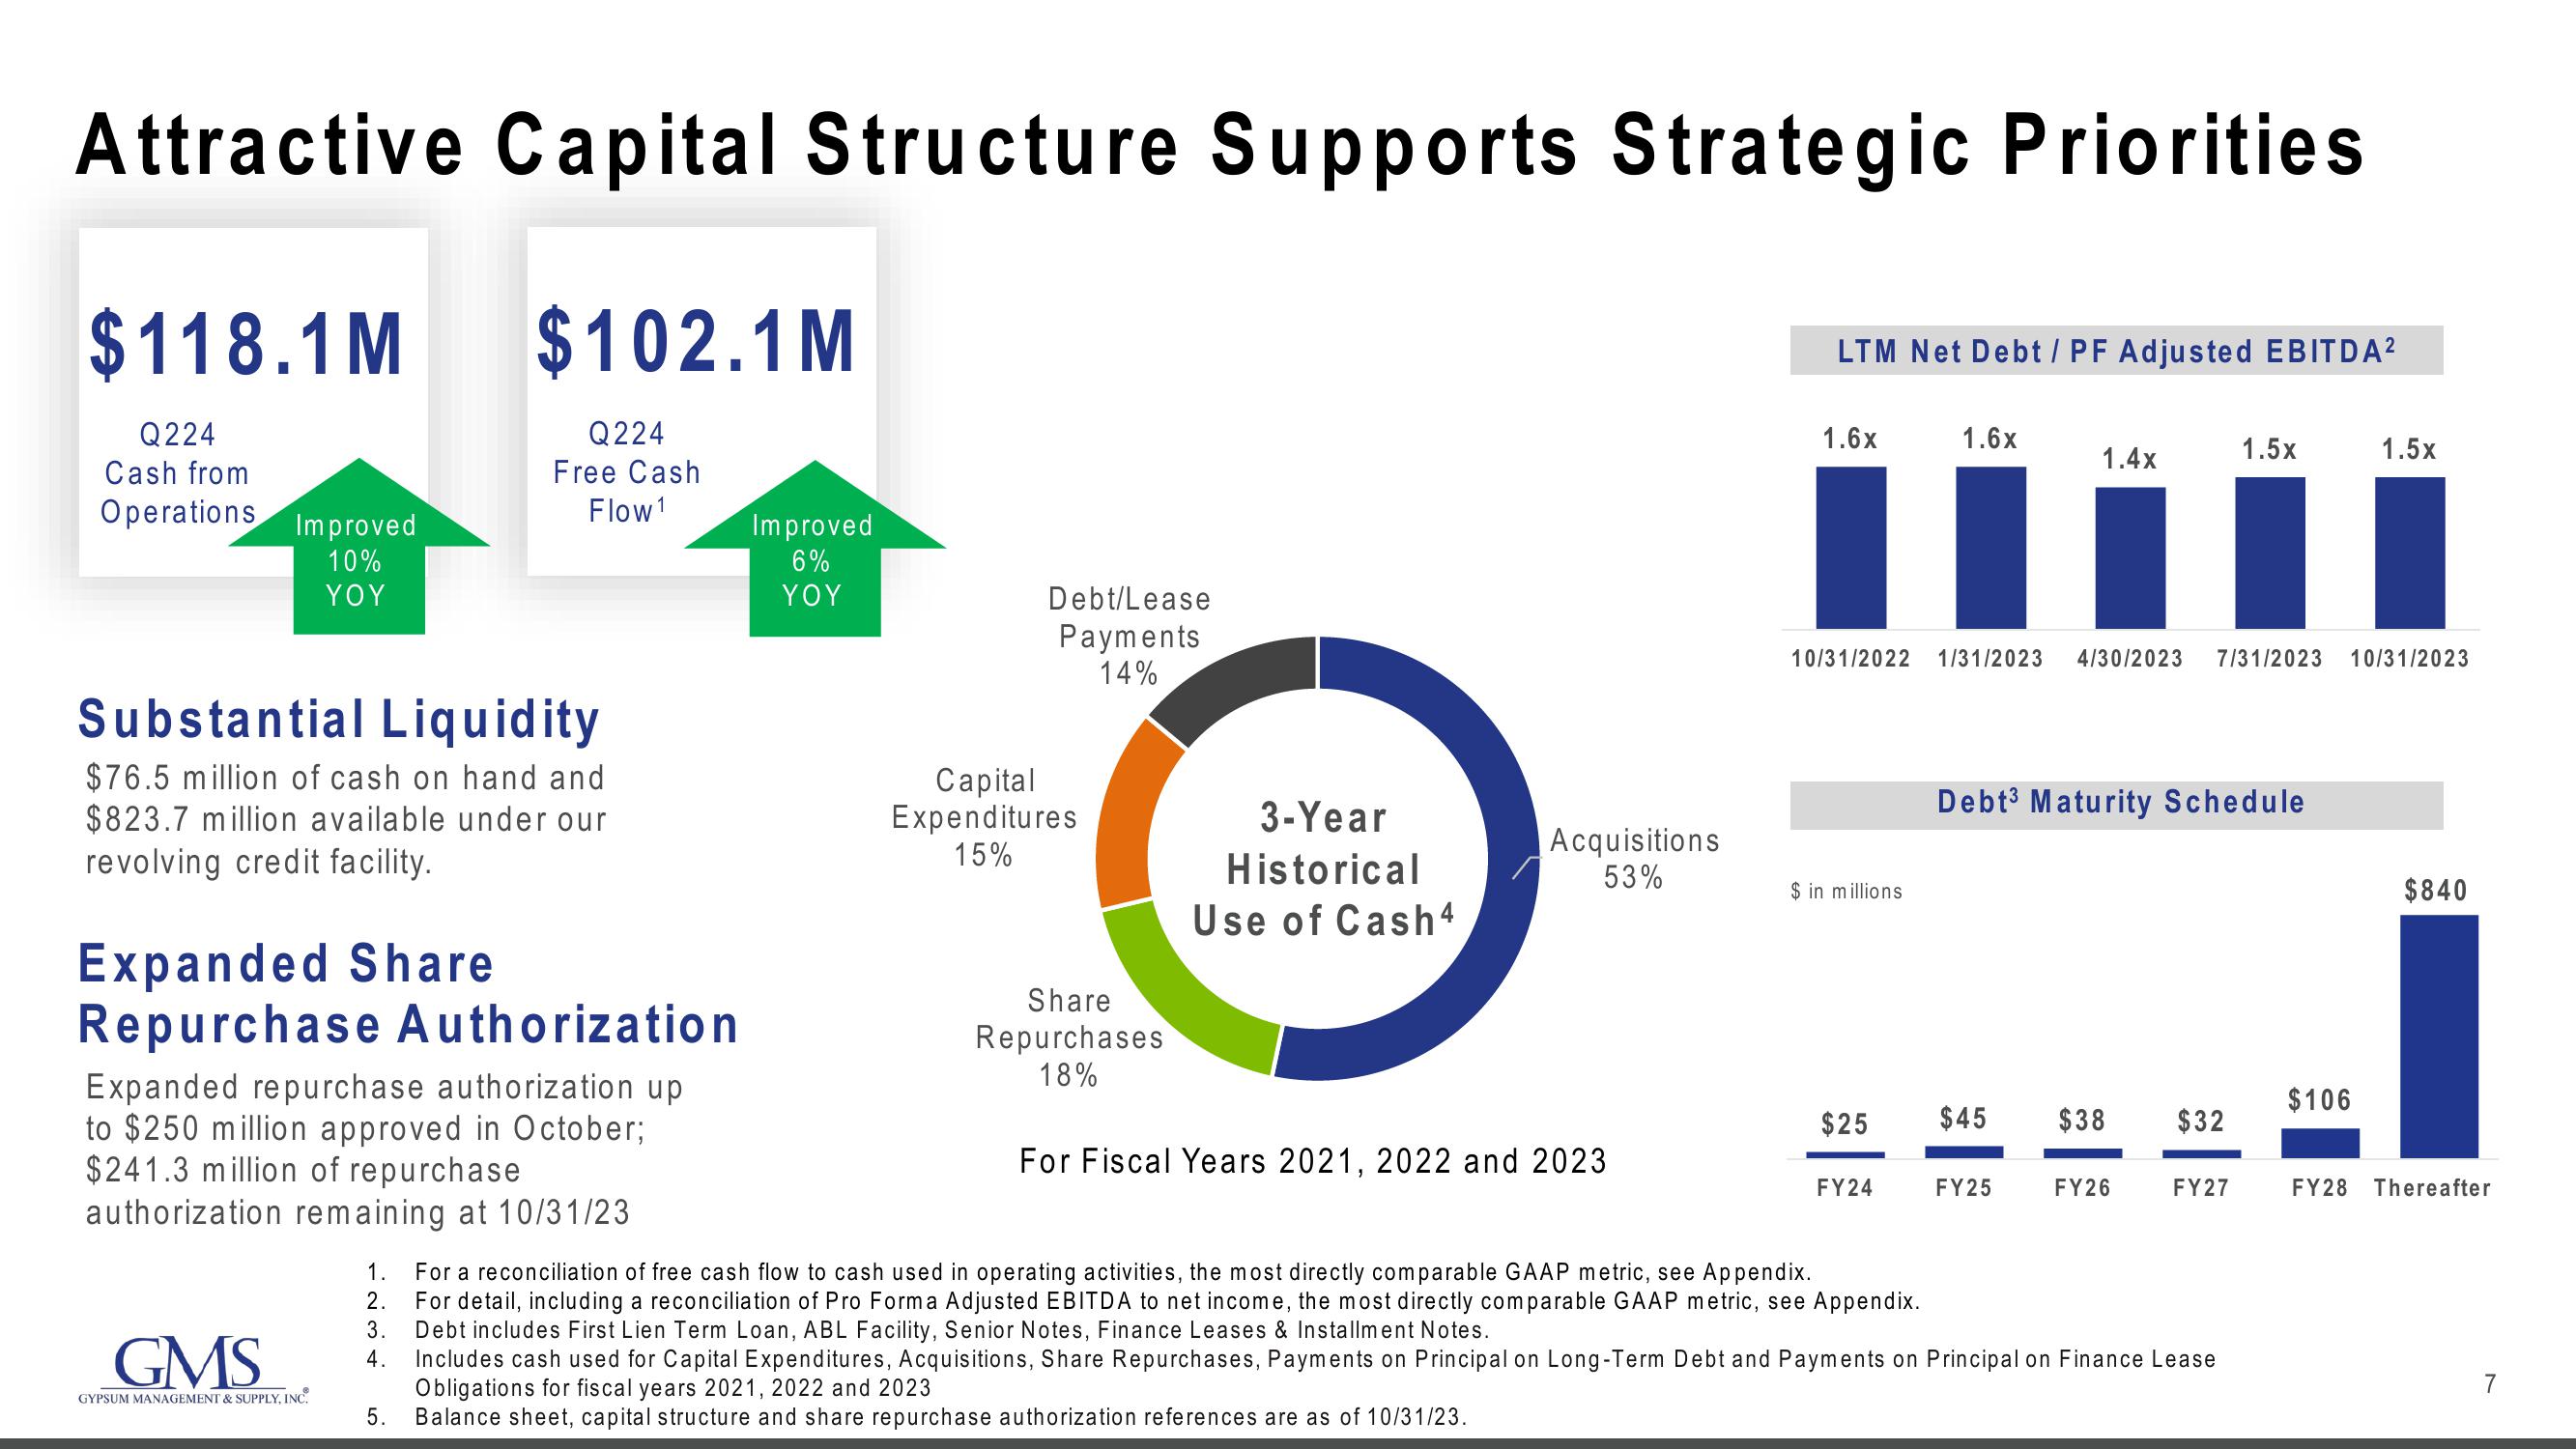
$118.1 M
$102.1M
Q224
Cash from
Operations Improved
10%
YOY
Substantial Liquidity
$76.5 million of cash on hand and
$823.7 million available under our
revolving credit facility.
Expanded Share
Repurchase Authorization
Q224
Free Cash
Flow 1
Expanded repurchase authorization up
to $250 million approved in October;
$241.3 million of repurchase
authorization remaining at 10/31/23
GMS
GYPSUM MANAGEMENT & SUPPLY, INC.
3.
4.
5.
Improved
6%
YOY
Debt/Lease
Payments
14%
Capital
Expenditures
15%
Share
Repurchases
18%
3-Year
Historical
Use of Cash4
Acquisitions
53%
For Fiscal Years 2021, 2022 and 2023
LTM Net Debt / PF Adjusted EBITDA²
1.6x
I
10/31/2022 1/31/2023 4/30/2023 7/31/2023 10/31/2023
$ in millions
$25
1.6x
FY24
$45
1.4x
Debt³ Maturity Schedule
FY25
$38 $32
FY26
1. For a reconciliation of free cash flow to cash used in operating activities, the most directly comparable GAAP metric, see Appendix.
2. For detail, including a reconciliation of Pro Forma Adjusted EBITDA to net income, the most directly comparable GAAP metric, see Appendix.
Debt includes First Lien Term Loan, ABL Facility, Senior Notes, Finance Leases & Installment Notes.
Includes cash used for Capital Expenditures, Acquisitions, Share Repurchases, Payments on Principal on Long-Term Debt and Payments on Principal on Finance Lease
Obligations for fiscal years 2021, 2022 and 2023
Balance sheet, capital structure and share repurchase authorization references are as of 10/31/23.
FY27
1.5x
$106
FY28
1.5x
$840
Thereafter
7View entire presentation