Inovalon Results Presentation Deck slide image

Inovalon Results Presentation Deck

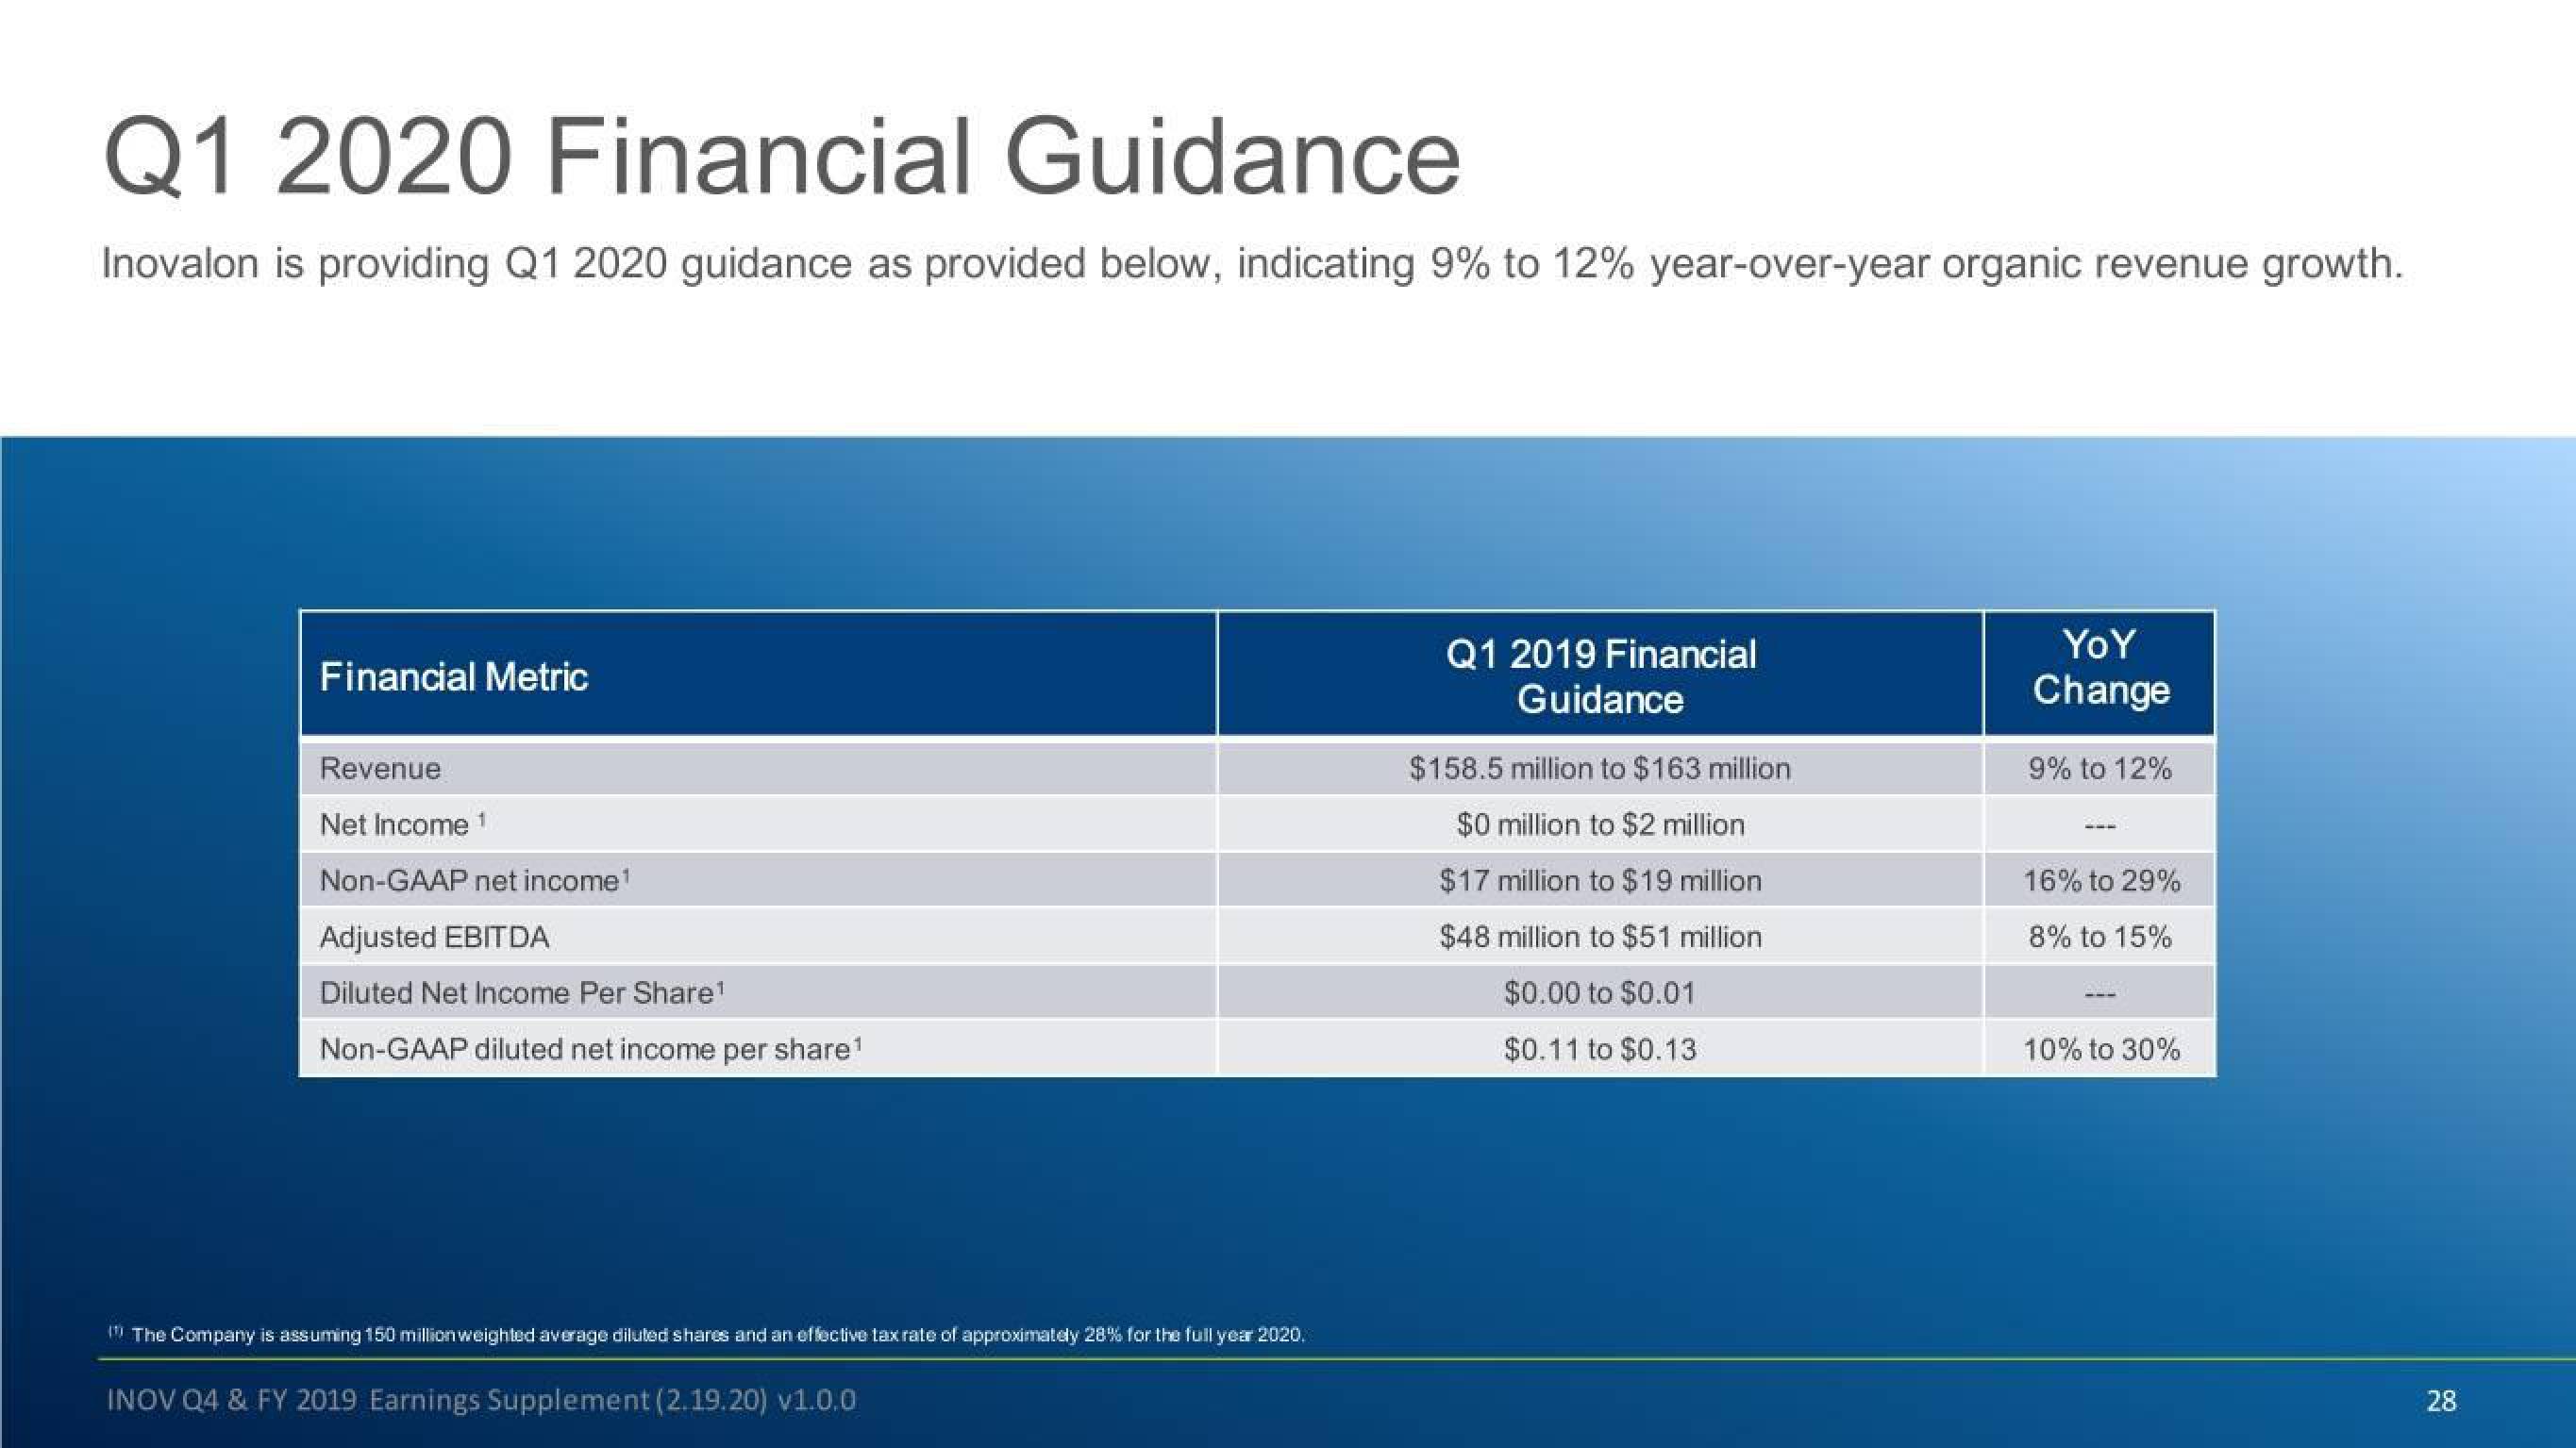
Q1 2020 Financial Guidance Inovalon is providing Q1 2020 guidance as provided below, indicating 9% to 12% year-over-year organic revenue growth. Financial Metric Revenue Net Income ¹ Non-GAAP net income¹ Adjusted EBITDA Diluted Net Income Per Share¹ Non-GAAP diluted net income per share¹ (The Company is assuming 150 million weighted average diluted shares and an effective tax rate of approximately 28% for the full year 2020. INOV Q4 & FY 2019 Earnings Supplement (2.19.20) v1.0.0 Q1 2019 Financial Guidance $158.5 million to $163 million $0 million to $2 million $17 million to $19 million $48 million to $51 million $0.00 to $0.01 $0.11 to $0.13 YOY Change 9% to 12% 16% to 29% 8% to 15% 10% to 30% 28
View entire presentation