Booking Holdings Shareholder Engagement Presentation Deck
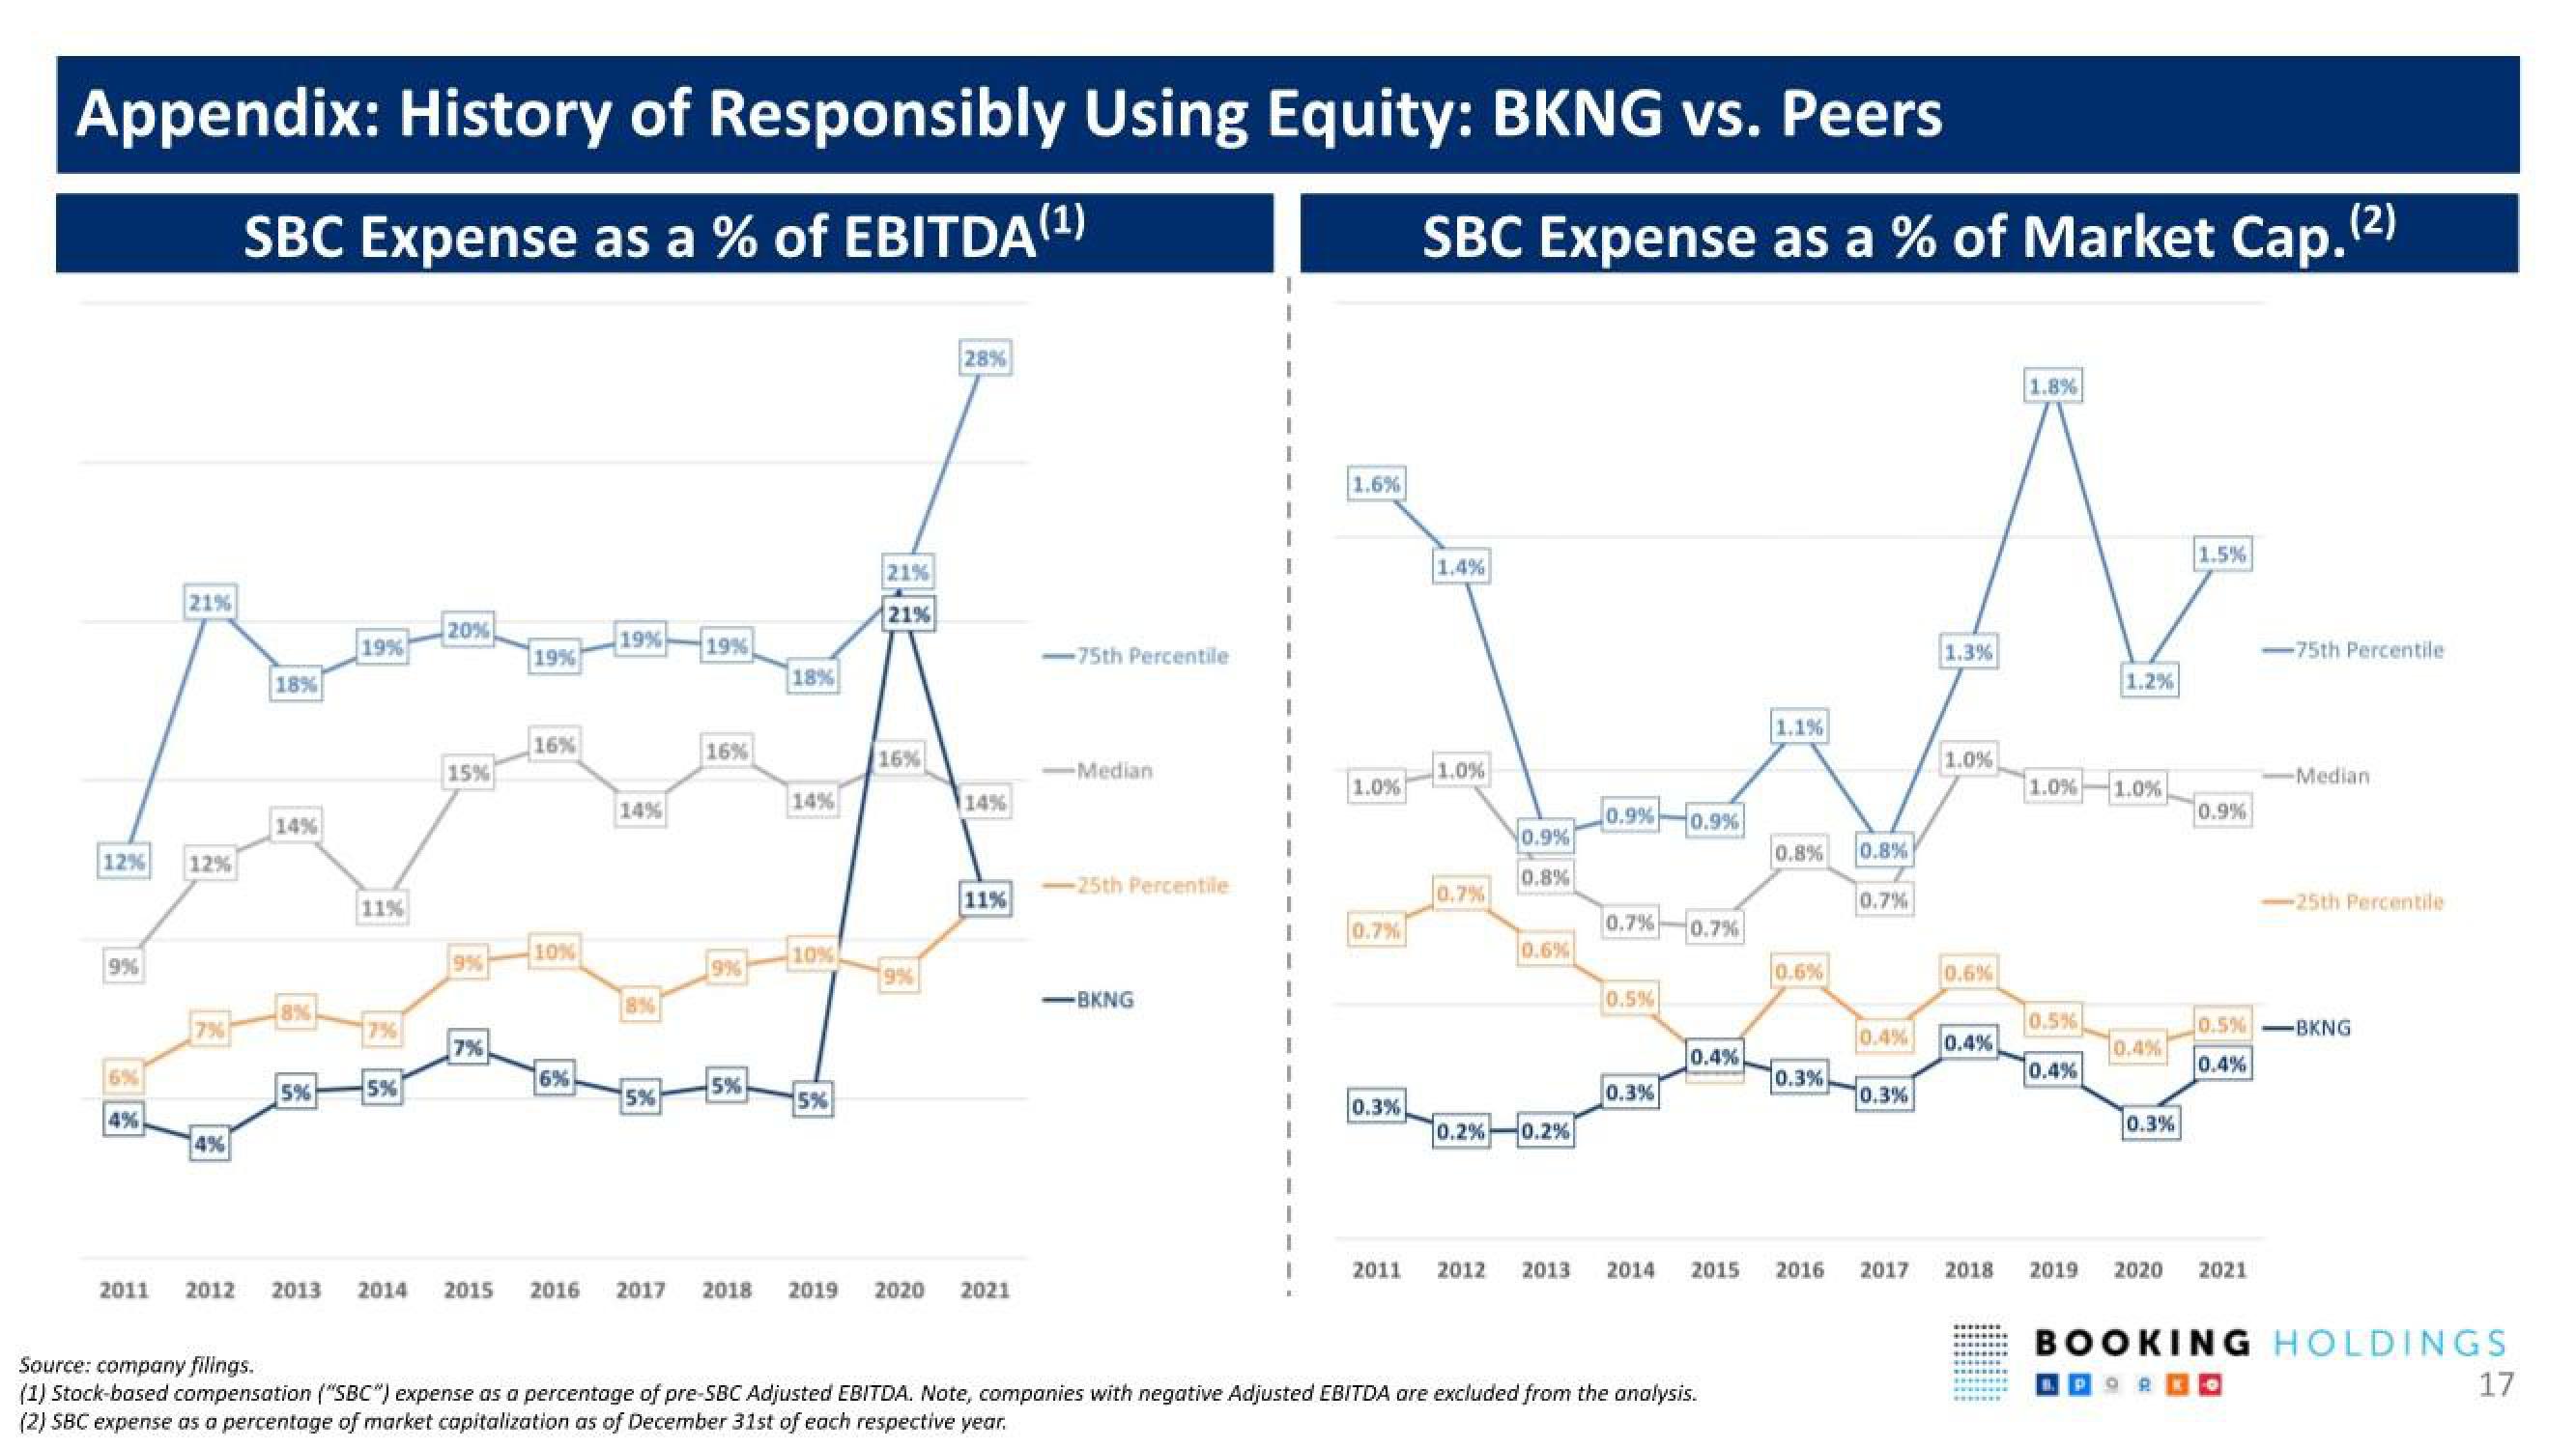
Appendix: History of Responsibly Using Equity: BKNG vs. Peers
SBC Expense as a % of EBITDA (¹)
12%
4%
21%
12%
18%
14%
8%
5%
19%
11%
7%
5%
20%
15%
7%
19%
16%
10%
6%
19%
14%
5%
19%
16%
9%
5%
18%
14%
10%
5%
21%
21%
16%
9%
28%
14%
11%
2011 2012 2013 2014 2015 2016 2017 2018 2019 2020 2021
-75th Percentile
-Median
-25th Percentile
=EKNG
1.6%
1.0%
0.7%
0.3%
SBC Expense as a % of Market Cap. (2)
1.4%
1.0%
0.7%
0.2%
0.9%
0.8%
0.6%
0.2%
0.9%
0.7% 0.7%
0.5%
0.3%
0.9%
2011 2012 2013 2014
0.4%
2015
Source: company filings.
(1) Stock-based compensation ("SBC") expense as a percentage of pre-SBC Adjusted EBITDA. Note, companies with negative Adjusted EBITDA are excluded from the analysis.
(2) SBC expense as a percentage of market capitalization as of December 31st of each respective year.
1.1%
0.8%
0.6%
0.3%
0.8%
0.7%
0.4%
0.3%
1.3%
1.0%
0.6%
0.4%
2016 2017 2018
1.8%
1.0% 1.0%
0.5%
1.2%
0.4%
0.4%
0.3%
1.5%
0.9%
-75th Percentile
2019 2020 2021
-Median
-25th Percentile
|0.50 –BKNG
0.4%
BOOKING HOLDINGS
17View entire presentation