AstraZeneca Results Presentation Deck
Rare Disease
Total Revenue ($m)
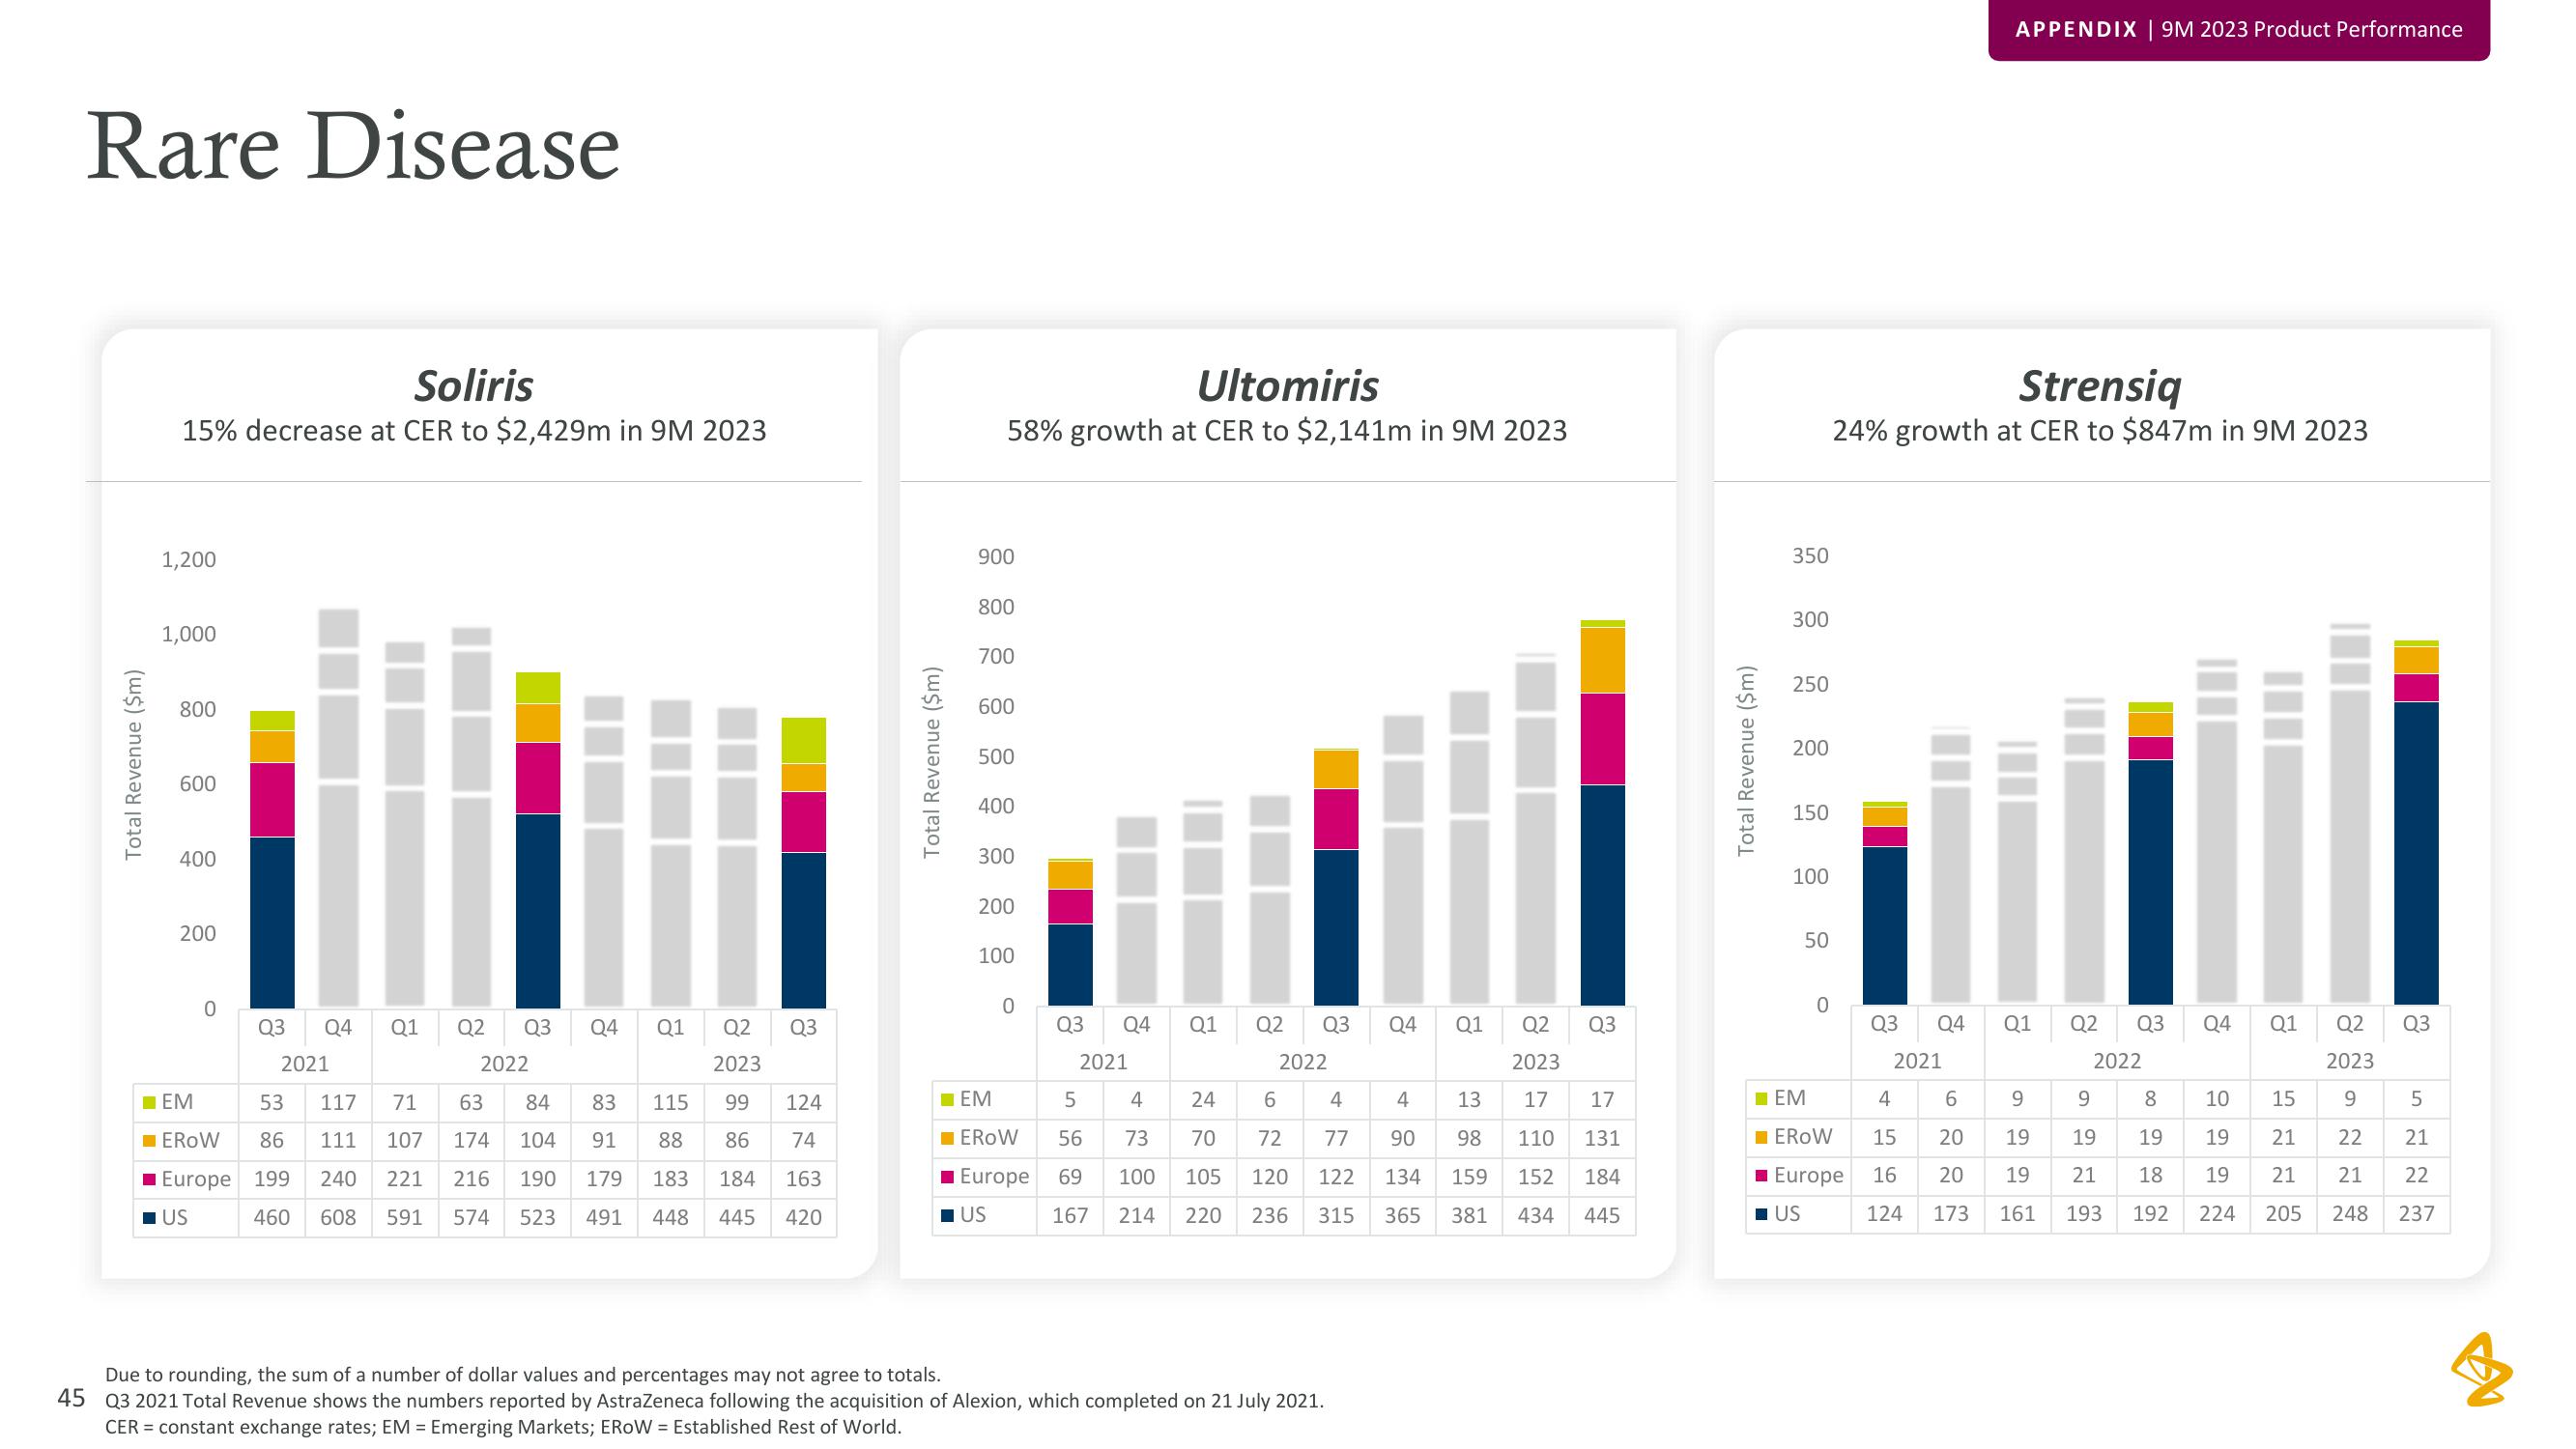
Soliris
15% decrease at CER to $2,429m in 9M 2023
1,200
1,000
800
600
400
200
0
Q3 Q4 Q1 Q2
2021
Q2
2023
83
115
88 86
99 124
91
74
221 216 190 179 183 184 163
591 574 523 491 448 445 420
☐EM
53
EROW 86
Europe 199 240
■US
460 608
Q3
2022
117 71 63 84
111 107 174 104
Q4
Q1
Q3
Total Revenue ($m)
Ultomiris
58% growth at CER to $2,141m in 9M 2023
900
800
700
600
500
400
300
200
100
0
Q3
Q4
2021
4
■EM
☐EROW
5
56
■ Europe 69 100
73
US
Q1
Q2
Q3 Q4
2022
24
6
4
70
72 77
105 120 122
167 214 220 236 315
Due to rounding, the sum of a number of dollar values and percentages may not agree to totals.
45 Q3 2021 Total Revenue shows the numbers reported by AstraZeneca following the acquisition of Alexion, which completed on 21 July 2021.
CER = constant exchange rates; EM = Emerging Markets; EROW = Established Rest of World.
Q1
4 13
90 98
134 159
381
365
Q2
2023
17 17
110 131
152 184
434 445
Q3
Total Revenue ($m)
350
300
250
200
150
100
50
0
Strensiq
24% growth at CER to $847m in 9M 2023
Q3 Q4
2021
APPENDIX | 9M 2023 Product Performance
☐EM
4 6
☐EROW 15 20
■ Europe 16 20
US
124 173
Q1
Q2 Q3 Q4 Q1 Q2
2023
2022
9
8
9
19
19
19
19 21
18
161 193 192
10
15 9
19
21
19 21
224 205
22
21
248
Q3
5
21
22
237View entire presentation