Second Quarter Fiscal Year 2020 Financial Results
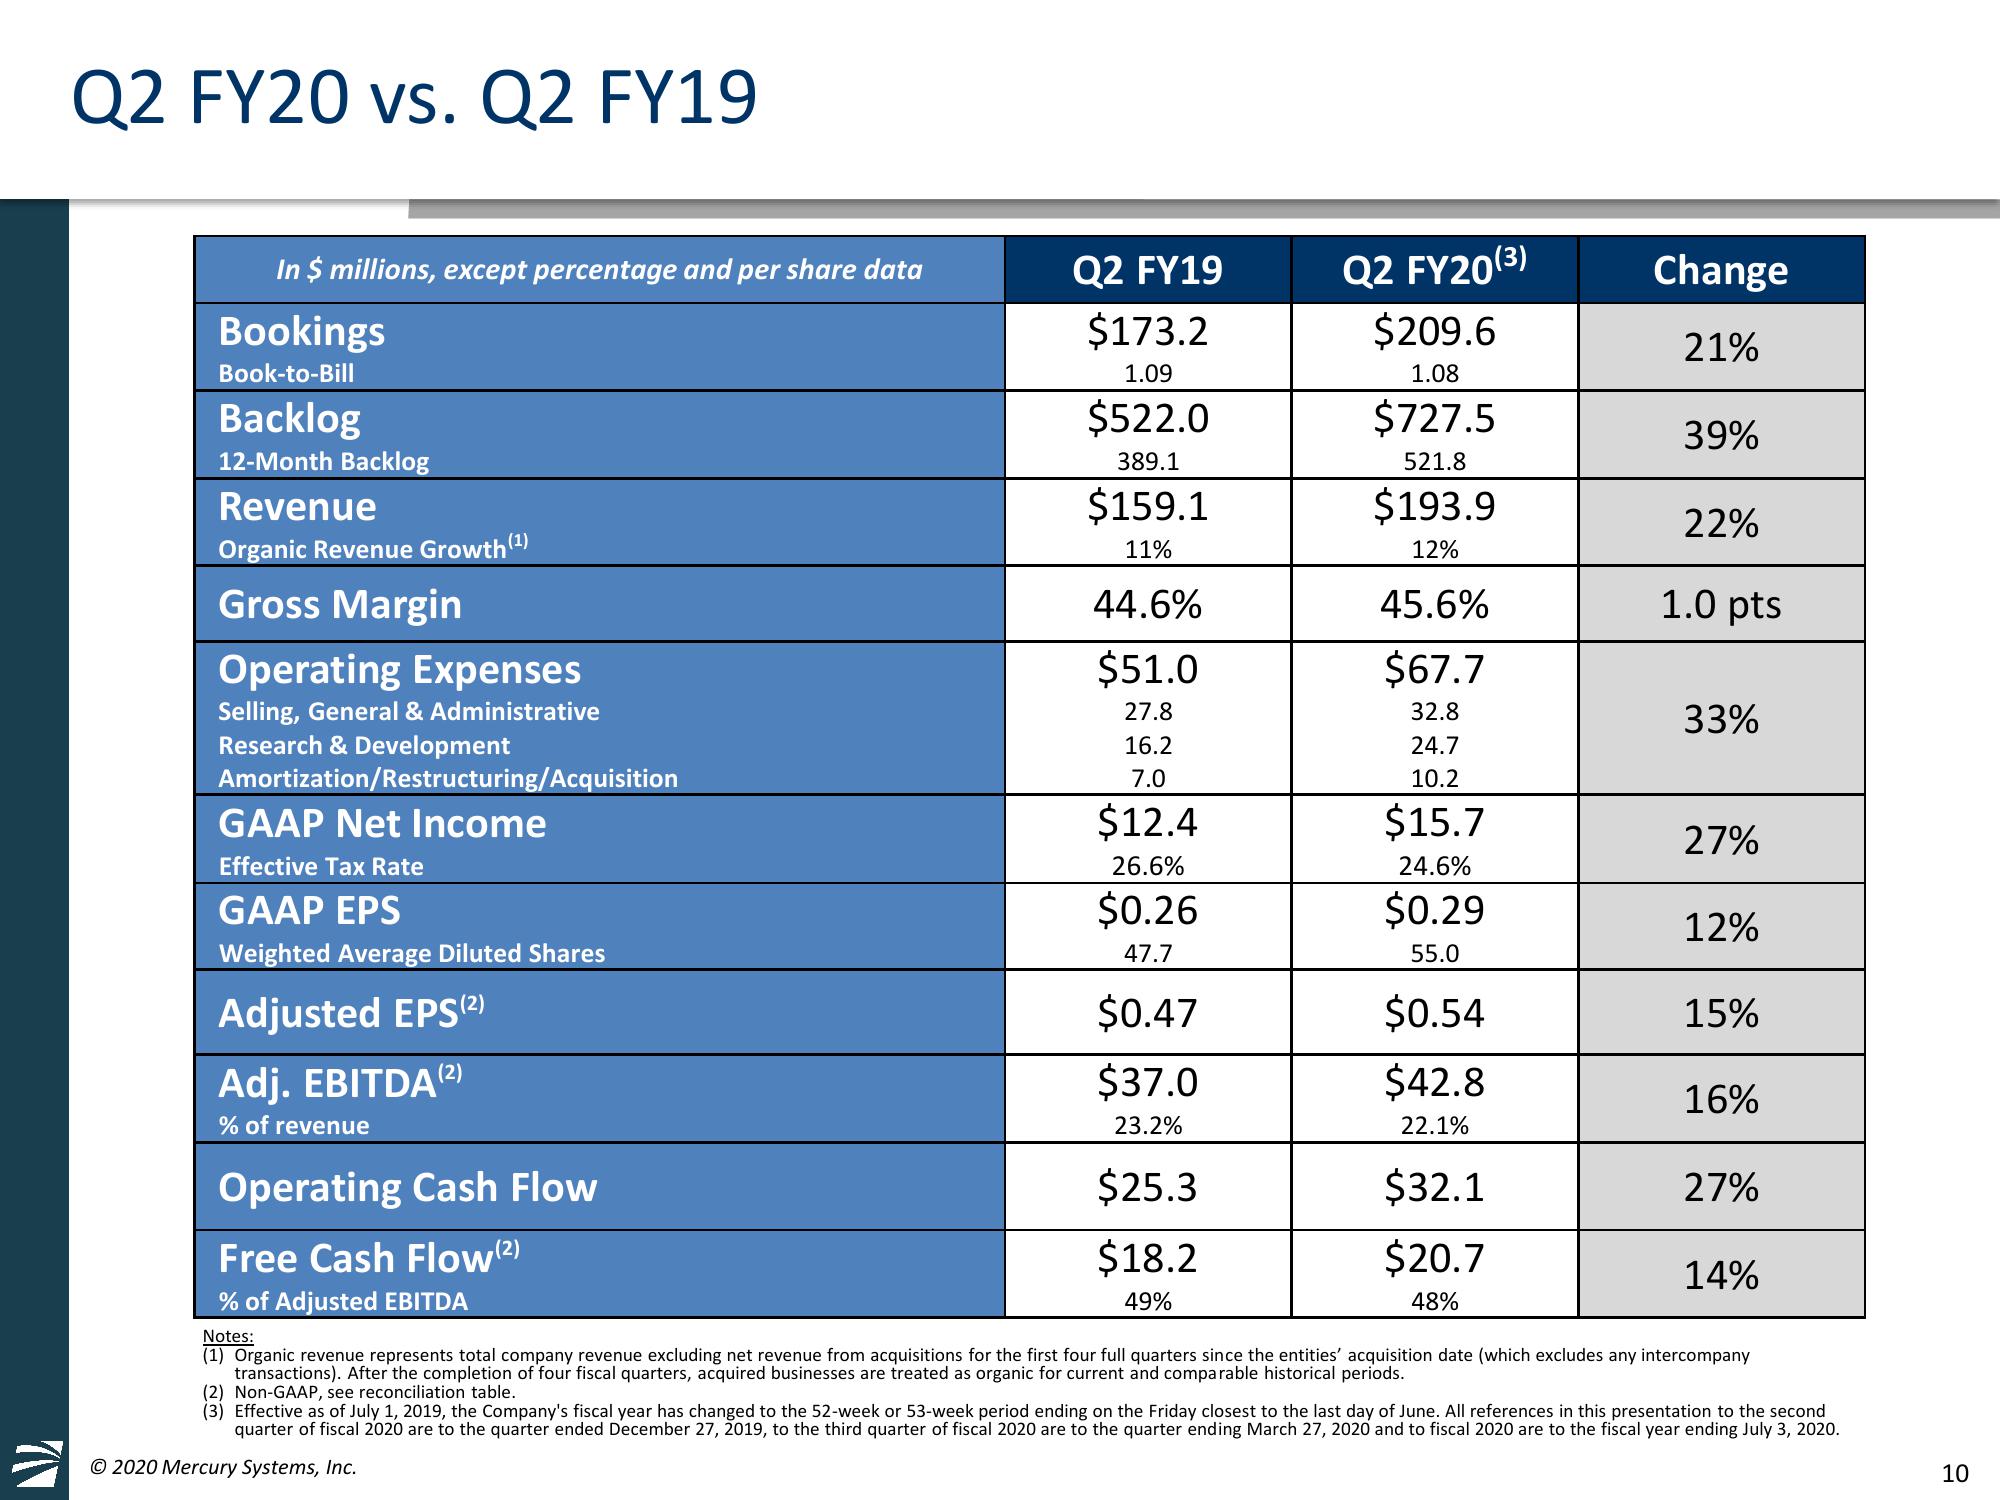
Q2 FY20 vs. Q2 FY19
In $ millions, except percentage and per share data
Bookings
Book-to-Bill
Backlog
12-Month Backlog
Revenue
Organic Revenue Growth (¹)
Gross Margin
Operating Expenses
Selling, General & Administrative
Research & Development
Amortization/Restructuring/Acquisition
GAAP Net Income
Effective Tax Rate
GAAP EPS
Weighted Average Diluted Shares
Adjusted EPS (2)
Adj. EBITDA (2)
% of revenue
Q2 FY19
$173.2
1.09
$522.0
389.1
$159.1
11%
44.6%
$51.0
27.8
16.2
7.0
$12.4
26.6%
$0.26
47.7
$0.47
$37.0
23.2%
Q2 FY20(3)
$209.6
1.08
$25.3
$18.2
49%
$727.5
521.8
$193.9
12%
45.6%
$67.7
32.8
24.7
10.2
$15.7
24.6%
$0.29
55.0
$0.54
$42.8
22.1%
$32.1
$20.7
48%
Change
21%
39%
22%
1.0 pts
33%
27%
12%
15%
16%
Operating Cash Flow
Free Cash Flow (²)
% of Adjusted EBITDA
Notes:
(1) Organic revenue represents total company revenue excluding net revenue from acquisitions for the first four full quarters since the entities' acquisition date (which excludes any intercompany
transactions). After the completion of four fiscal quarters, acquired businesses are treated as organic for current and comparable historical periods.
(2) Non-GAAP, see reconciliation table.
(3) Effective as of July 1, 2019, the Company's fiscal year has changed to the 52-week or 53-week period ending on the Friday closest to the last day of June. All references in this presentation to the second
quarter of fiscal 2020 are to the quarter ended December 27, 2019, to the third quarter of fiscal 2020 are to the quarter ending March 27, 2020 and to fiscal 2020 are to the fiscal year ending July 3, 2020.
© 2020 Mercury Systems, Inc.
27%
14%
10View entire presentation