Credit Suisse Results Presentation Deck
Asset Management
PTI adversely affected by continued market uncertainty
Revenues
PCL/
Costs
Profitability
AuM
Balance
Sheet
in CHF mn
Management fees
Perf., transaction & placement rev.
Investment and partnership income¹
Adjusted net revenues
Provision for credit losses
Adjusted total operating expenses
Adjusted pre-tax income
Reported pre-tax income
Adjusted RoRC+
Reported RoRCt
Adjusted cost/income ratio
Assets under management in CHF bn
Net new assets in CHF bn
Risk-weighted assets in CHF bn
Leverage exposure in CHF bn
3Q22
250
33
63
346
(1)
243
104
90
49%
43%
70%
411
(4.2)
9
2022
258
5
48
311
2
278
31
30
15%
14%
89%
427
(6.1)
9
3
3Q21
287
75
43
405
1
273
131
18
57%
8%
67%
475
(1.7)
8
3
A 3Q21
(13)%
(56)%
47%
(15)%
(11)%
(21)%
400%
(13)%
2%
7%
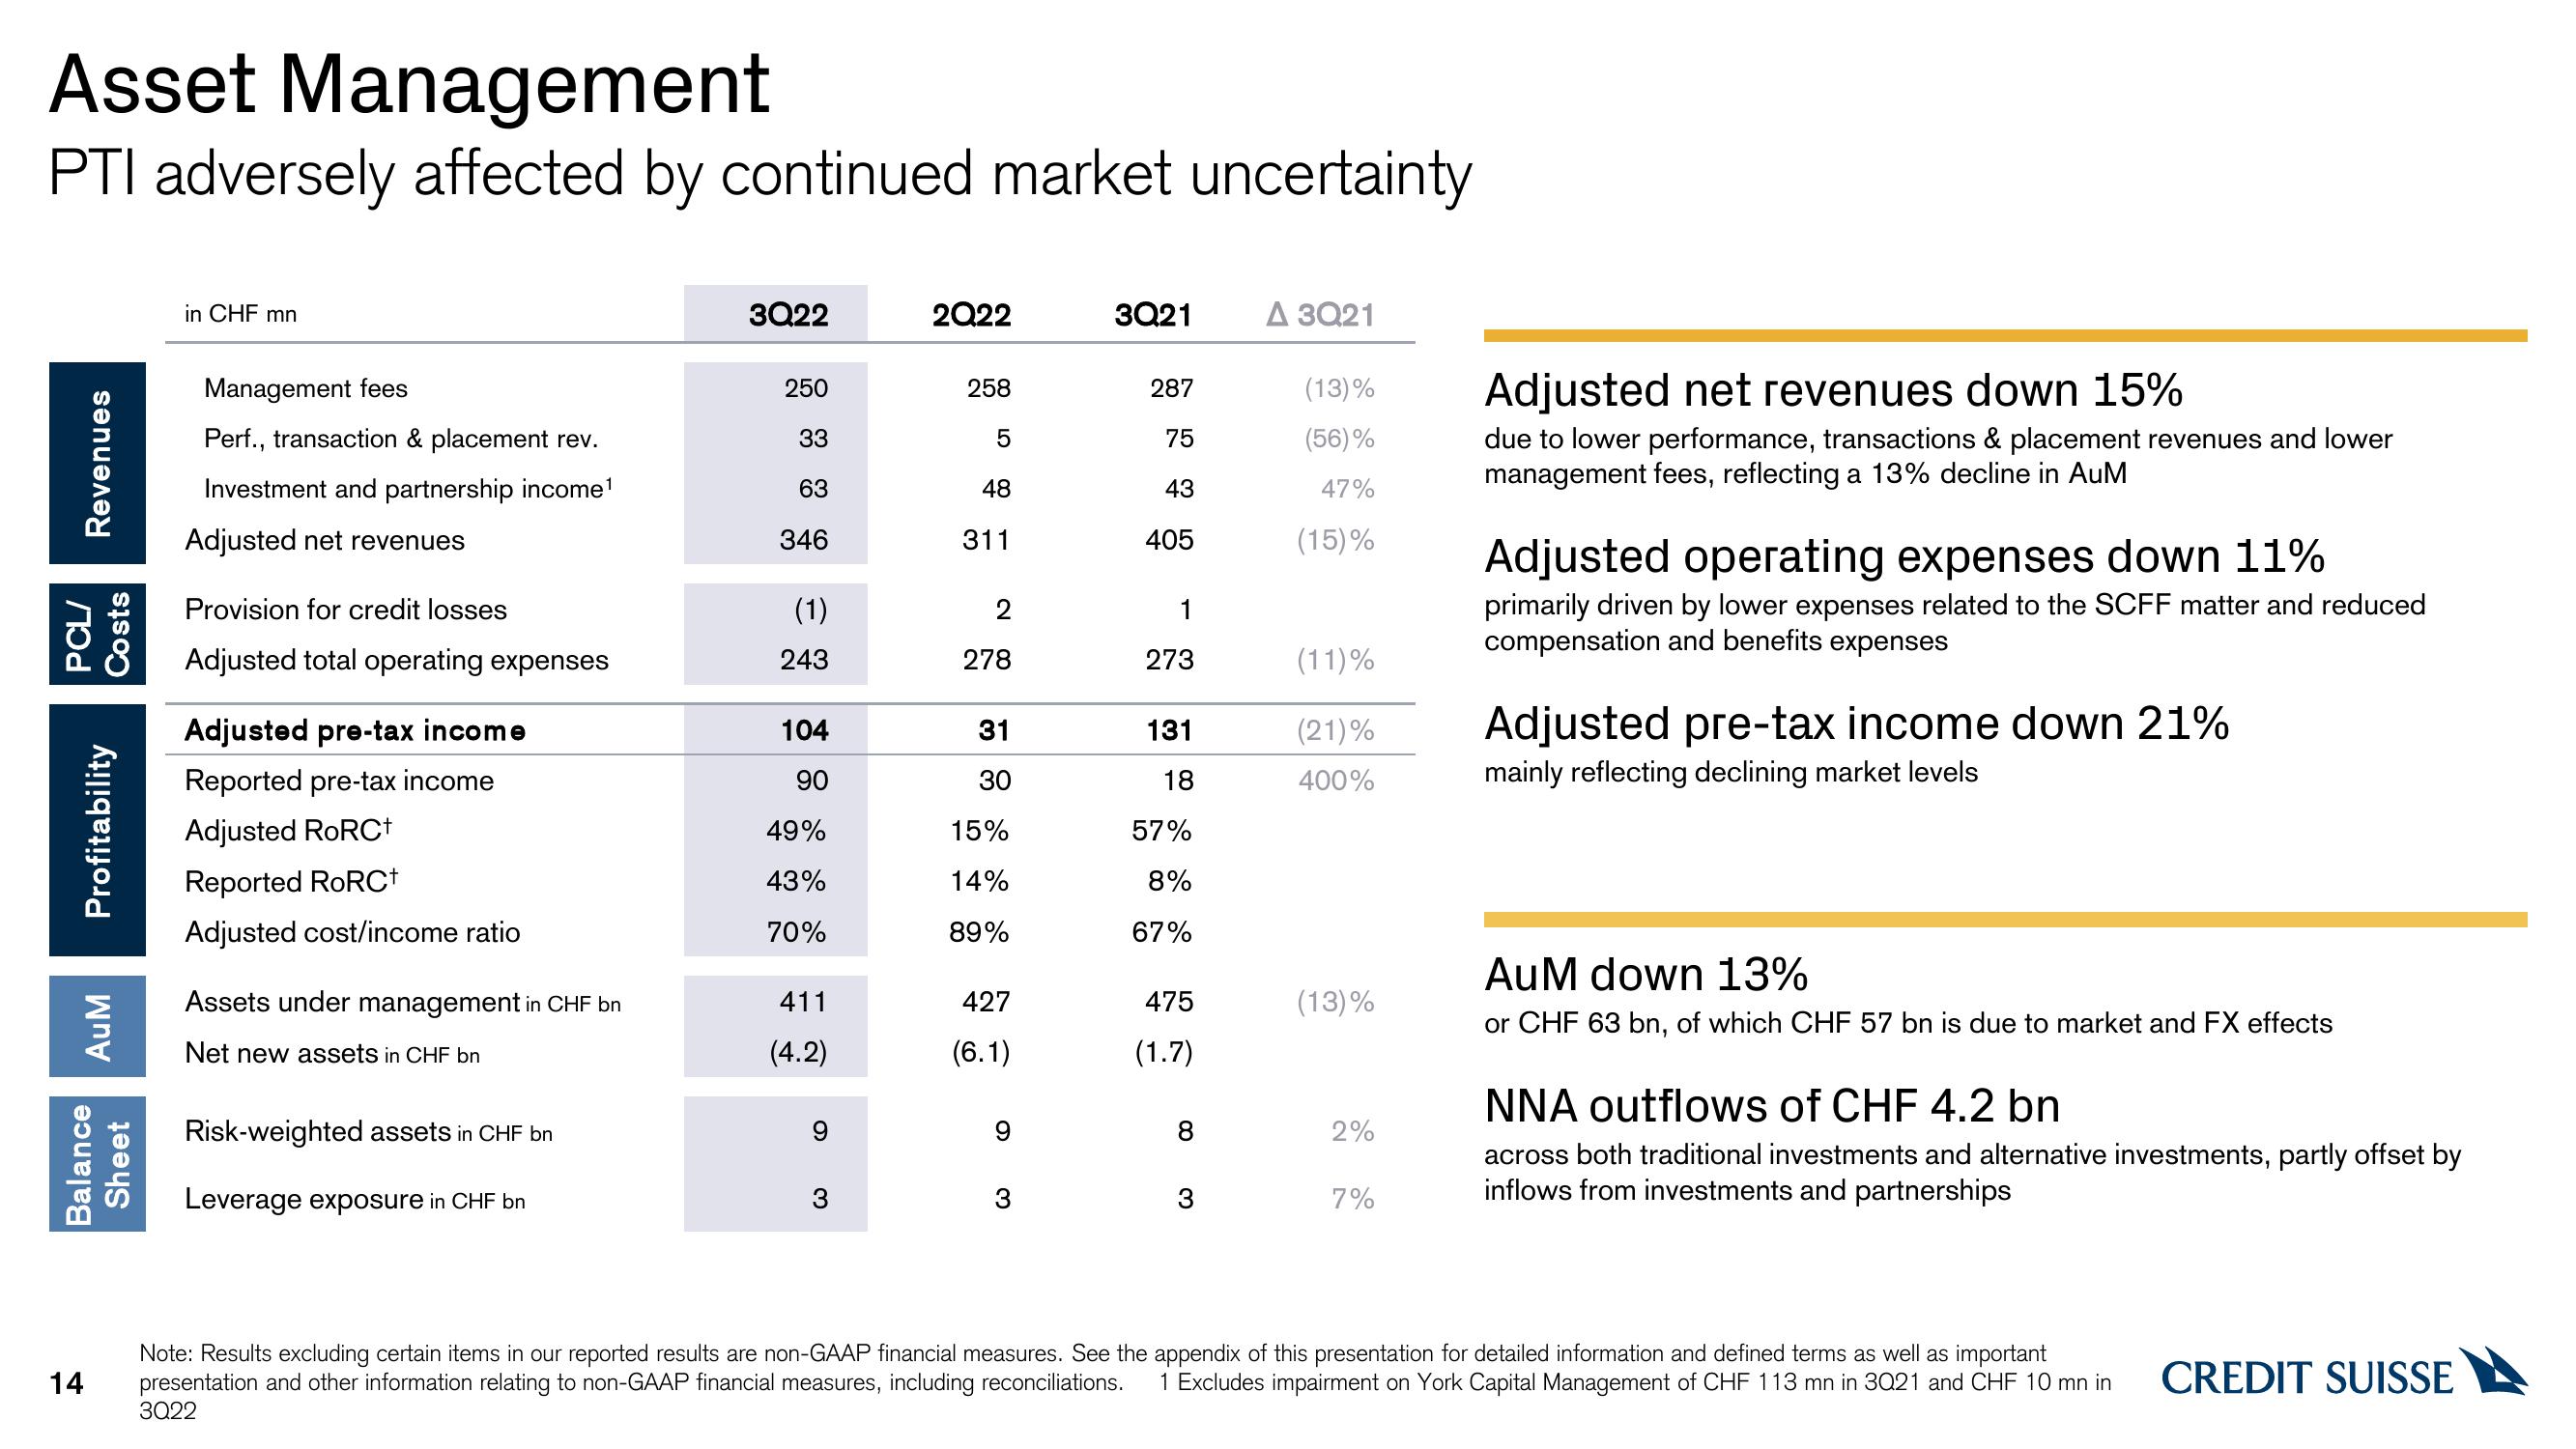
Adjusted net revenues down 15%
due to lower performance, transactions & placement revenues and lower
management fees, reflecting a 13% decline in AuM
Adjusted operating expenses down 11%
primarily driven by lower expenses related to the SCFF matter and reduced
compensation and benefits expenses
Adjusted pre-tax income down 21%
mainly reflecting declining market levels
AuM down 13%
or CHF 63 bn, of which CHF 57 bn is due to market and FX effects
NNA outflows of CHF 4.2 bn
across both traditional investments and alternative investments, partly offset by
inflows from investments and partnerships
Note: Results excluding certain items in our reported results are non-GAAP financial measures. See the appendix of this presentation for detailed information and defined terms as well as important
14 presentation and other information relating to non-GAAP financial measures, including reconciliations. 1 Excludes impairment on York Capital Management of CHF 113 mn in 3Q21 and CHF 10 mn in CREDIT SUISSE
3Q22View entire presentation