Ashtead Group Results Presentation Deck
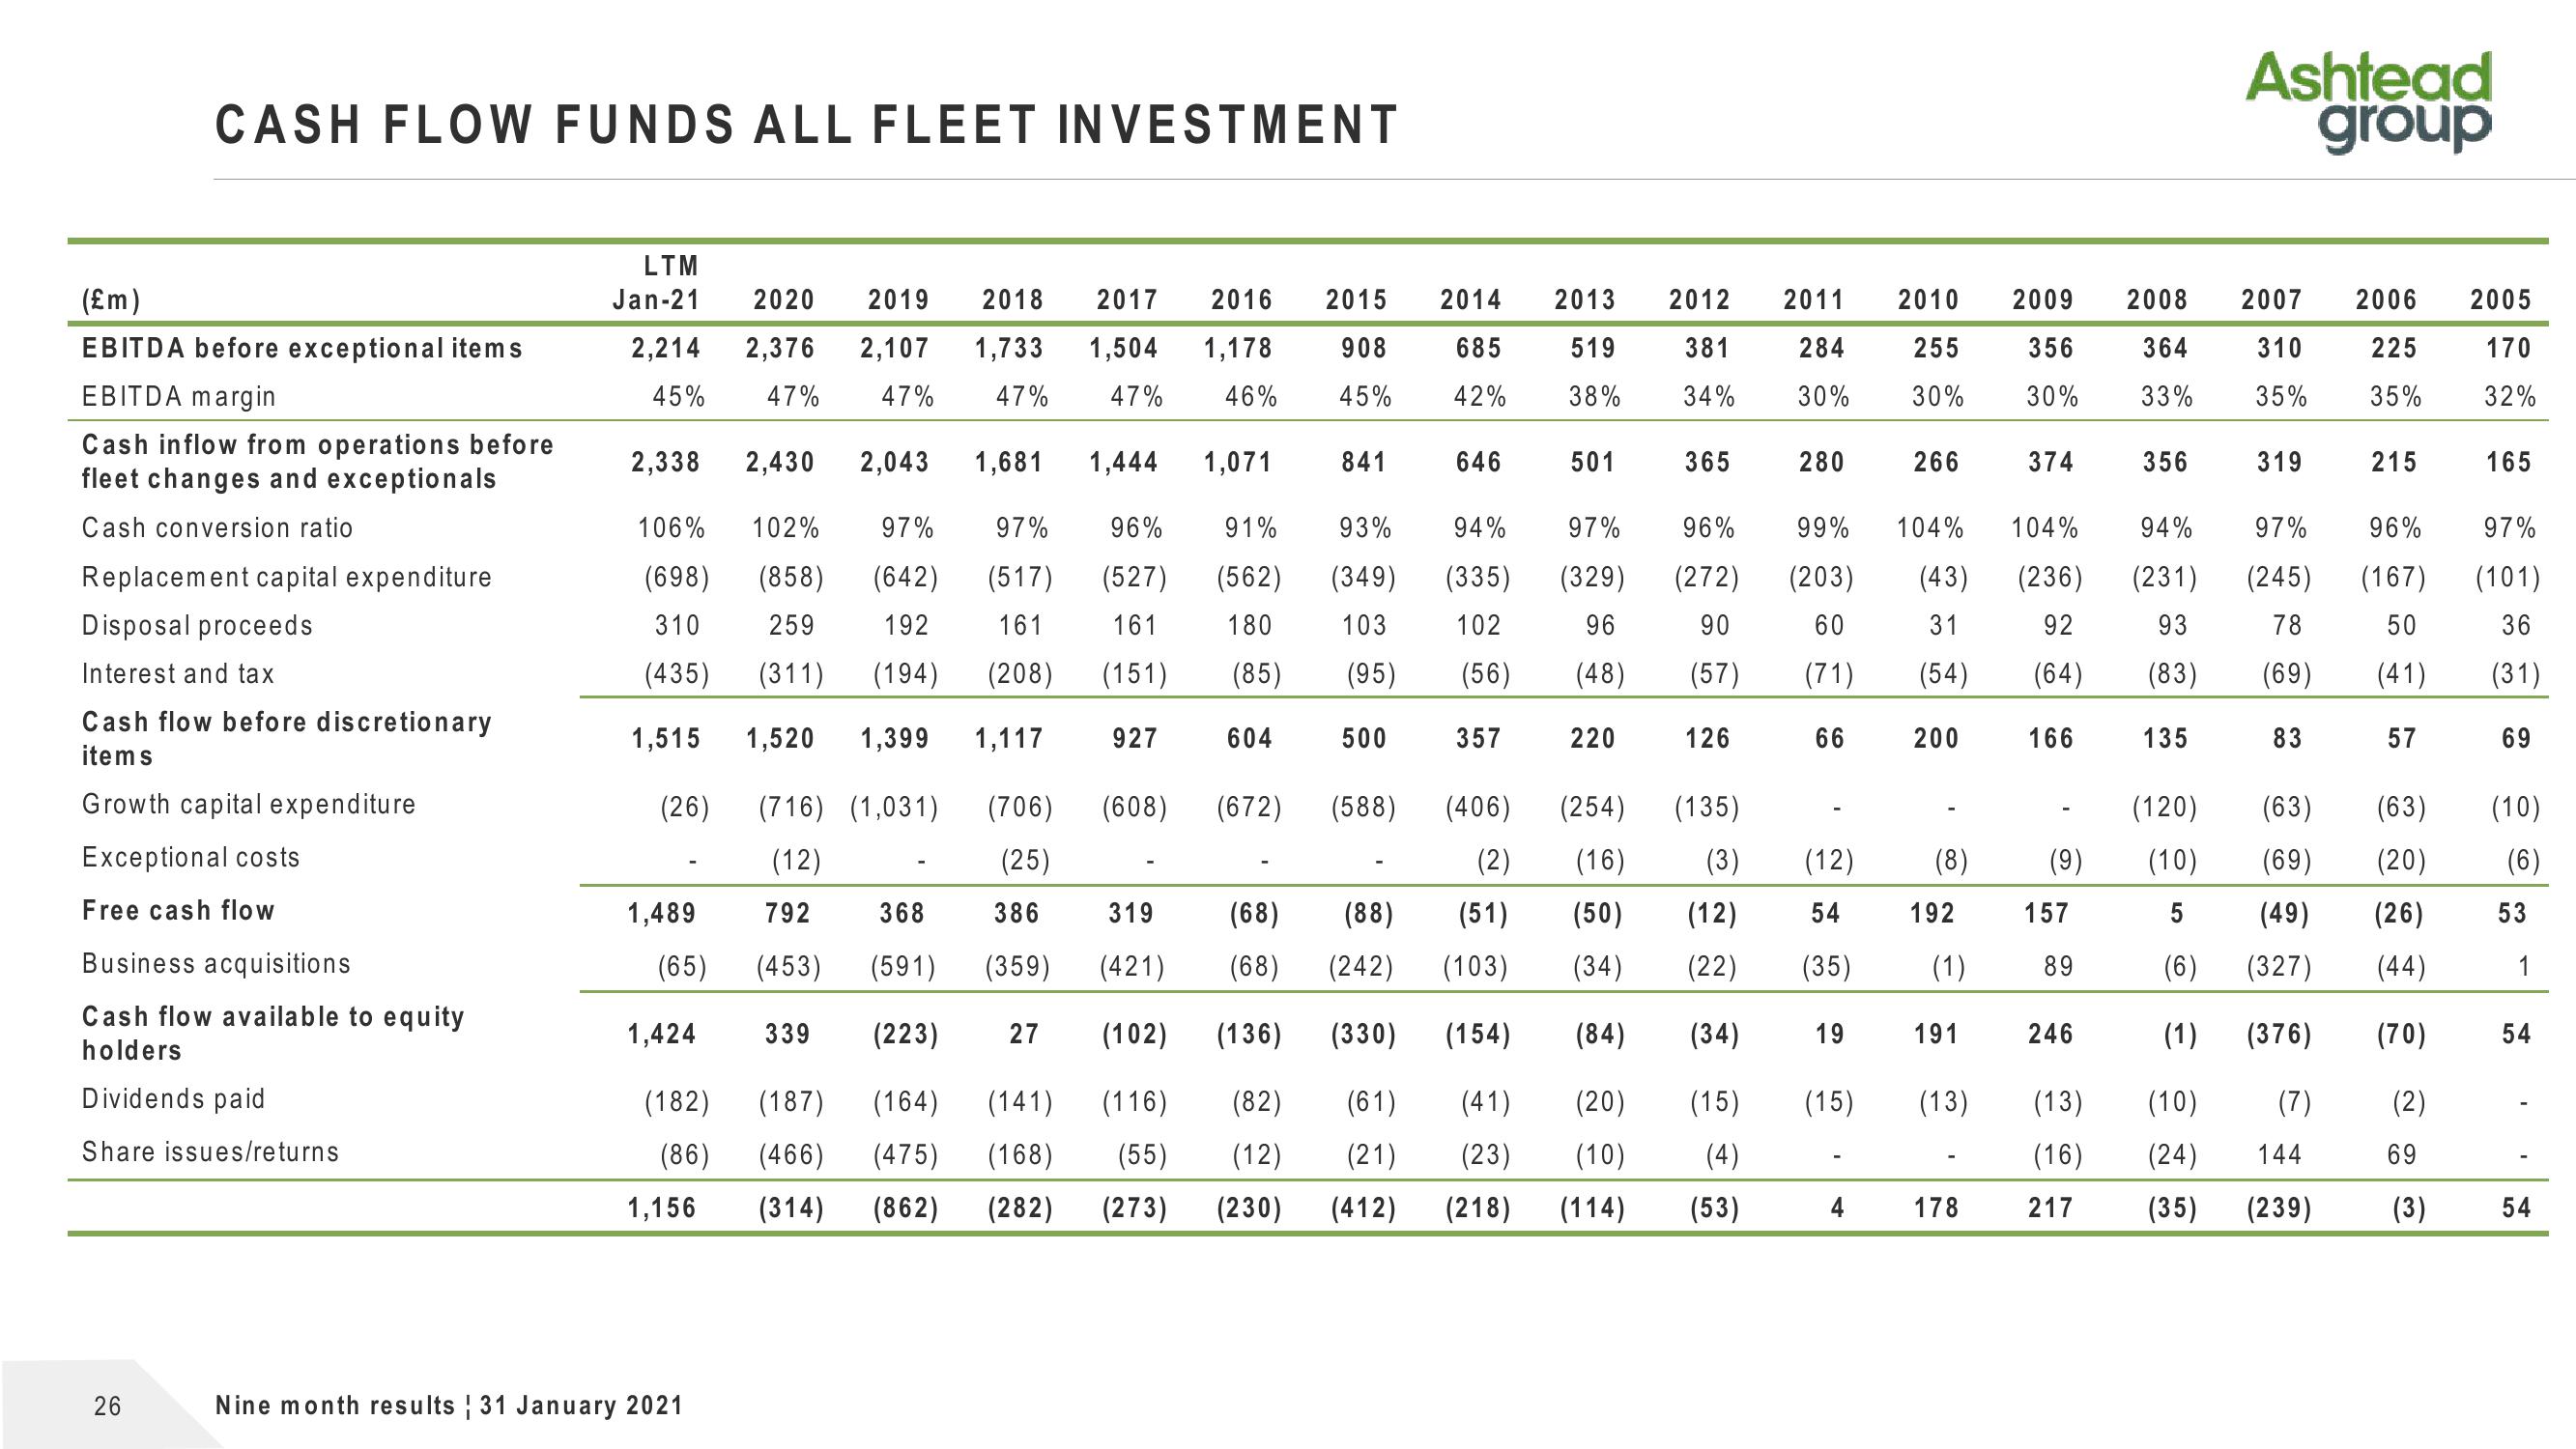
CASH FLOW FUNDS ALL FLEET INVESTMENT
(£m)
EBITDA before exceptional items
EBITDA margin
Cash inflow from operations before
fleet changes and exceptionals
Cash conversion ratio
Replacement capital expenditure
Disposal proceeds
Interest and tax
Cash flow before discretionary
items
Growth capital expenditure
Exceptional costs
Free cash flow
Business acquisitions
Cash flow available to equity
holders
Dividends paid
Share issues/returns
26
LTM
Jan-21 2020 2019
2018 2017 2016 2015
2,214 2,376 2,107 1,733 1,504 1,178 908
45% 47% 47% 47% 47% 46% 45%
1,681 1,444 1,071
91%
96%
(527) (562)
161
180
(151)
(85)
927
604
2,338
106%
(698)
310
(435)
1,515
(26) (716) (1,031) (706)
(12)
(25)
1,489
(65)
1,424
(182)
(86)
1,156
2,430 2,043
102%
97% 97%
(858) (642) (517)
259 192 161
(311) (194) (208)
1,520 1,399 1,117
Nine month results 31 January 2021
792
(453)
339
(608)
(466) (475)
(187) (164) (141)
(168)
(282)
(314)
(862)
(672)
368
386
319
(421) (68)
(591)
(359)
(223) 27 (102) (136)
841
93%
(349)
103
(95)
500
(588)
(68) (88)
(242)
(330)
(116) (82) (61)
(55) (12) (21)
(273) (230) (412)
2014
685
42%
646
94%
(335)
102
(56)
357
2013 2012 2011
381 284
34% 30%
519
38%
501
97%
(329)
96
(48)
220
365
280
96% 99%
(272) (203)
90
60
(57) (71)
126
(406) (254)
(135)
(2)
(16)
(3)
(51)
(50)
(12)
(103) (34) (22)
(154)
(84)
(34)
(41)
(20)
(15)
(23) (10) (4)
(218) (114) (53)
66
19
(15)
2010
255
30%
4
266
(12)
54
(35) (1)
200
104% 104%
(43)
(236)
31
92
(54)
(64)
166
(8)
192
191
(13)
2009 2008
356
30%
364
33%
178
374
(9)
157
89
246
(13)
(16)
217
356
94%
(231)
93
(83)
135
Ashtead
group
2007
310
35%
319
97%
(245)
78
(69)
83
(63)
(120)
(10)
(69)
5
(49)
(6)
(327)
(1) (376)
(10)
(7)
(24)
144
(35) (239)
2006 2005
225
35%
170
32%
215
96%
(167)
50
(41)
57
(63)
(20)
(26)
(44)
(70)
(2)
165
97%
(101)
36
(31)
69
(10)
(6)
53
1
54
69
(3) 54View entire presentation